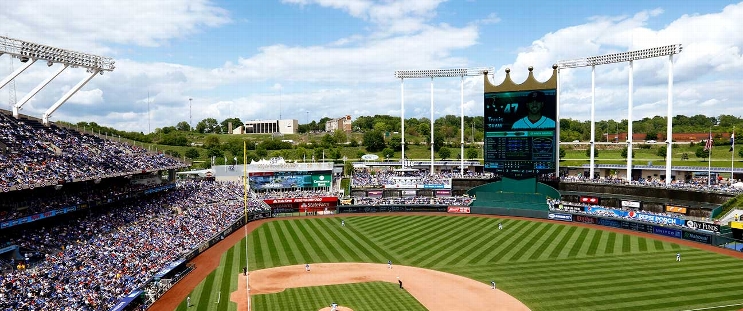
New York Mets at Kansas City Royals
· Major League Baseball
8 - 3

Mark Vientos and Francisco Lindor lead the Mets past the Royals, 8-3

Brandon Nimmo singled to open the eighth and Francisco Lindor and Juan Soto walked to load the bases against Steven Cruz (2-1). Carlos Estévez entered to strike out Pete Alonso before Vientos cleared the bases for a 4-3 lead.
Lindor added his 19th homer in the ninth. He has 29 home runs and 81 RBI against the Royals, his most against any opponent. Juan Soto followed with his 22nd homer, the sixth pair of back-to-back homers by the Mets.
Huascar Brazobán (5-2) won after allowing four hits and a two-run homer by Bobby Witt Jr. while pitching the seventh.
Kodai Senga returned from the injured list to make his first start in since leaving a June 12 start with a right hamstring strain.
Working on a pitch limit, Senga threw four scoreless innings, allowing four hits and two walks, striking out four.
Michael Wacha allowed a run on two hits and three walks in five innings, striking out five.
How can I watch New York Mets vs. Kansas City Royals?
- TV Channel: Mets at Royals 2022 MLB Baseball, is broadcasted on MLB.TV.
- Online streaming: Sign up for Fubo.
Scoring Summary
 |
9th Inning | Witt Jr. grounded out to pitcher. |
 |
9th Inning | India grounded out to pitcher. |
 |
9th Inning | Fermin popped out to third. |
 |
9th Inning | Devenski relieved Garrett |
 |
9th Inning | Fermin hit for Tolbert |
 |
9th Inning | Acuña grounded into double play, pitcher to second to first, Vientos out at second. |
Statistics
 NYM NYM |
 KC KC |
|
|---|---|---|
| 1 | Games Played | 1 |
| 1 | Team Games Played | 1 |
| 0 | Hit By Pitch | 0 |
| 8 | Ground Balls | 13 |
| 12 | Strikeouts | 6 |
| 8 | Runs Batted In | 3 |
| 1 | Sacrifice Hit | 0 |
| 8 | Hits | 10 |
| 0 | Stolen Bases | 0 |
| 8 | Walks | 2 |
| 0 | Catcher Interference | 0 |
| 8 | Runs | 3 |
| 1 | Ground Into Double Play | 0 |
| 0 | Sacrifice Flies | 0 |
| 33 | At Bats | 36 |
| 2 | Home Runs | 1 |
| 0 | Grand Slam Home Runs | 0 |
| 16 | Runners Left On Base | 15 |
| 0 | Triples | 0 |
| 1 | Game Winning RBIs | 0 |
| 1 | Intentional Walks | 0 |
| 2 | Doubles | 3 |
| 14 | Fly Balls | 17 |
| 0 | Caught Stealing | 1 |
| 170 | Pitches | 142 |
| 0 | Games Started | 0 |
| 1 | Pinch At Bats | 1 |
| 0 | Pinch Hits | 0 |
| 0.0 | Player Rating | 0.0 |
| 1 | Is Qualified | 1 |
| 0 | Is Qualified In Steals | 1 |
| 16 | Total Bases | 16 |
| 42 | Plate Appearances | 38 |
| 324.0 | Projected Home Runs | 162.0 |
| 4 | Extra Base Hits | 4 |
| 6.4 | Runs Created | 4.7 |
| .242 | Batting Average | .278 |
| .000 | Pinch Hit Average | .000 |
| .485 | Slugging Percentage | .444 |
| .485 | Secondary Average | .194 |
| .390 | On Base Percentage | .316 |
| .875 | OBP Pct + SLG Pct | .760 |
| 0.6 | Ground To Fly Ball Ratio | 0.8 |
| 6.4 | Runs Created Per 27 Outs | 4.7 |
| 50.0 | Batter Rating | 31.0 |
| 16.5 | At Bats Per Home Run | 36.0 |
| 0.00 | Stolen Base Percentage | 0.00 |
| 4.05 | Pitches Per Plate Appearance | 3.74 |
| .242 | Isolated Power | .167 |
| 0.67 | Walk To Strikeout Ratio | 0.33 |
| .190 | Walks Per Plate Appearance | .053 |
| .242 | Secondary Average Minus Batting Average | -.083 |
| 16.0 | Runs Produced | 6.0 |
| 1.0 | Runs Ratio | 1.0 |
| 0.6 | Patience Ratio | 0.5 |
| 0.3 | Balls In Play Average | 0.3 |
| 92.0 | MLB Rating | 83.3 |
| 0.0 | Offensive Wins Above Replacement | 0.0 |
| 0.0 | Wins Above Replacement | 0.0 |
Game Information

Location: Kansas City, Missouri
Attendance: 28,268 | Capacity:
2025 National League East Standings
| TEAM | W | L | PCT | GB | STRK |
|---|---|---|---|---|---|
 Philadelphia Philadelphia |
55 | 41 | .573 | - | W1 |
 New York New York |
55 | 42 | .567 | 0.5 | L1 |
 Miami Miami |
44 | 51 | .463 | 10.5 | W2 |
 Atlanta Atlanta |
42 | 53 | .442 | 12.5 | L1 |
 Washington Washington |
38 | 58 | .396 | 17 | L4 |
2025 American League Central Standings
| TEAM | W | L | PCT | GB | STRK |
|---|---|---|---|---|---|
 Detroit Detroit |
59 | 38 | .608 | - | L4 |
 Minnesota Minnesota |
47 | 49 | .490 | 11.5 | L1 |
 Kansas City Kansas City |
47 | 50 | .485 | 12 | W1 |
 Cleveland Cleveland |
46 | 49 | .484 | 12 | W2 |
 Chicago Chicago |
32 | 65 | .330 | 27 | L2 |