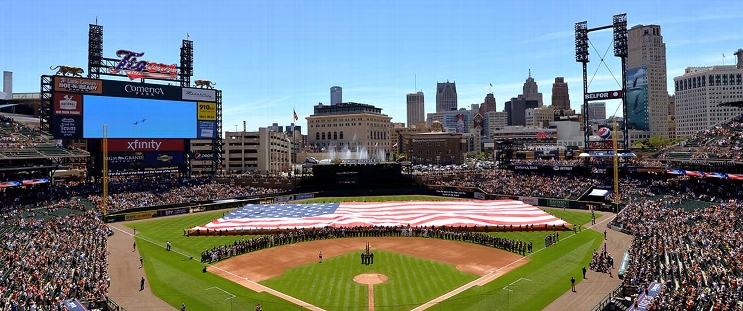
Seattle Mariners at Detroit Tigers
· Major League Baseball
8 - 4

Mariners beat MLB-leading Tigers 8-4, sweeping 3-game series before All-Star break

Julio Rodriguez, Randy Arozarena and Mitch Garver also hit solo home runs for the Mariners, who humbled the major league-leading Tigers with 12-3 and 15-7 wins in the first two games of the series.
Seattle's 35 runs is the most they have scored in a three-game series since 2002.
The Tigers are taking a season-high four-game losing streak into the All-Star break.
After Polanco broke a 4-all tie in the ninth and Young created a two-run cushion, the Mariners scored two more runs.
Matt Brash (1-0) struck out two in the eighth to earn the win.
Tommy Kahnle (1-2) gave up three runs on two hits and a walk without getting an out in the pivotal ninth.
Detroit scored two unearned runs off Logan Gilbert in the first inning, taking advantage of Luke Raley's throwing error, and went ahead again in the seventh on Riley Greene's 24th homer of the season.
Seattle's Cal Raleigh went 0 for 2 with three walks, leaving him with an AL-record 38 homers before the All-Star Game — one shy of Barry Bonds’ 2001 major league record for homers before the break. Raleigh stole a base, joining Babe Ruth (1921), Reggie Jackson (1969) and Ken Griffey Jr. (1998) as players with at least 38 homers and 10 stolen bases in their team's first 96 games.
How can I watch Seattle Mariners vs. Detroit Tigers?
- TV Channel: Mariners at Tigers 2022 MLB Baseball, is broadcasted on MLB.TV.
- Online streaming: Sign up for Fubo.
Scoring Summary
 |
9th Inning | Sweeney struck out swinging. |
 |
9th Inning | Báez grounded out to shortstop. |
 |
9th Inning | Meadows lined out to first. |
 |
9th Inning | Muñoz relieved Brash |
 |
9th Inning | Moore at third base. |
 |
9th Inning | Solano at first base. |
Statistics
 SEA SEA |
 DET DET |
|
|---|---|---|
| 1 | Games Played | 1 |
| 1 | Team Games Played | 1 |
| 0 | Hit By Pitch | 0 |
| 11 | Ground Balls | 9 |
| 10 | Strikeouts | 13 |
| 7 | Runs Batted In | 4 |
| 0 | Sacrifice Hit | 0 |
| 10 | Hits | 8 |
| 2 | Stolen Bases | 1 |
| 7 | Walks | 2 |
| 0 | Catcher Interference | 0 |
| 8 | Runs | 4 |
| 1 | Ground Into Double Play | 0 |
| 0 | Sacrifice Flies | 1 |
| 35 | At Bats | 34 |
| 5 | Home Runs | 1 |
| 0 | Grand Slam Home Runs | 0 |
| 17 | Runners Left On Base | 11 |
| 0 | Triples | 0 |
| 1 | Game Winning RBIs | 0 |
| 1 | Intentional Walks | 0 |
| 3 | Doubles | 1 |
| 14 | Fly Balls | 13 |
| 0 | Caught Stealing | 0 |
| 175 | Pitches | 150 |
| 0 | Games Started | 0 |
| 1 | Pinch At Bats | 2 |
| 1 | Pinch Hits | 0 |
| 0.0 | Player Rating | 0.0 |
| 1 | Is Qualified | 1 |
| 1 | Is Qualified In Steals | 1 |
| 28 | Total Bases | 12 |
| 42 | Plate Appearances | 37 |
| 810.0 | Projected Home Runs | 162.0 |
| 8 | Extra Base Hits | 2 |
| 10.7 | Runs Created | 3.6 |
| .286 | Batting Average | .235 |
| 1.000 | Pinch Hit Average | .000 |
| .800 | Slugging Percentage | .353 |
| .771 | Secondary Average | .206 |
| .405 | On Base Percentage | .270 |
| 1.205 | OBP Pct + SLG Pct | .623 |
| 0.8 | Ground To Fly Ball Ratio | 0.7 |
| 11.1 | Runs Created Per 27 Outs | 3.6 |
| 63.0 | Batter Rating | 30.0 |
| 7.0 | At Bats Per Home Run | 34.0 |
| 1.00 | Stolen Base Percentage | 1.00 |
| 4.17 | Pitches Per Plate Appearance | 4.05 |
| .514 | Isolated Power | .118 |
| 0.70 | Walk To Strikeout Ratio | 0.15 |
| .167 | Walks Per Plate Appearance | .054 |
| .486 | Secondary Average Minus Batting Average | -.029 |
| 15.0 | Runs Produced | 8.0 |
| 0.9 | Runs Ratio | 1.0 |
| 0.9 | Patience Ratio | 0.4 |
| 0.3 | Balls In Play Average | 0.4 |
| 105.5 | MLB Rating | 78.3 |
| 0.0 | Offensive Wins Above Replacement | 0.0 |
| 0.0 | Wins Above Replacement | 0.0 |
Game Information

Location: Detroit, Michigan
Attendance: 34,671 | Capacity:
2025 American League West Standings
| TEAM | W | L | PCT | GB | STRK |
|---|---|---|---|---|---|
 Houston Houston |
56 | 40 | .583 | - | L1 |
 Seattle Seattle |
51 | 45 | .531 | 5 | W3 |
 Texas Texas |
48 | 49 | .495 | 8.5 | W1 |
 Los Angeles Los Angeles |
47 | 49 | .490 | 9 | L1 |
 Athletics Athletics |
41 | 57 | .418 | 16 | W2 |
2025 American League Central Standings
| TEAM | W | L | PCT | GB | STRK |
|---|---|---|---|---|---|
 Detroit Detroit |
59 | 38 | .608 | - | L4 |
 Minnesota Minnesota |
47 | 49 | .490 | 11.5 | L1 |
 Kansas City Kansas City |
47 | 50 | .485 | 12 | W1 |
 Cleveland Cleveland |
46 | 49 | .484 | 12 | W2 |
 Chicago Chicago |
32 | 65 | .330 | 27 | L2 |