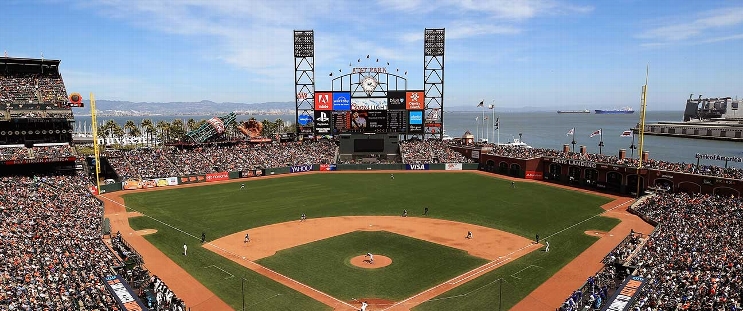
Los Angeles Dodgers at San Francisco Giants
· Major League Baseball
5 - 2

Freddie Freeman's bloop single in 11th starts winning rally as Dodgers beat Giants 5-2

Spencer Bivens (2-3) intentionally walked Shohei Ohtani to start the 11th and retired Mookie Betts and Will Smith before Freeman delivered with a ball that dropped between three Giants.
Teoscar Hernández then beat out an infield single for an insurance run and Andy Pages followed with an RBI single.
Ben Casparius (7-3) got Willy Adames to ground out ending the 10th, then pitched a perfect 11th for the win.
Pinch-hitter Luis Matos hit a tying two-run homer in the ninth after Matt Chapman's one-out single started the rally against Tanner Scott, who blew his seventh save in 26 opportunities.
Miguel Rojas homered and Freeman had an early RBI double that had Los Angeles ahead until the ninth.
Dodgers starter and first-time All-Star Yoshinobu Yamamoto struck out seven over seven innings and allowed three hits.
The defending World Series champion Dodgers (58-39) entered the All-Star break atop the NL West after finishing the first half with nine straight games against clubs with winning records.
Manager Dave Roberts and his staff head to manage the NL All-Stars in Atlanta, where he said Sunday he plans to pitch left-hander Clayton Kershaw early in what could be his final Midsummer Classic.
Los Angeles had done just enough against Giants lefty Robbie Ray in a game featuring just 11 total hits.
How can I watch Los Angeles Dodgers vs. San Francisco Giants?
- TV Channel: Dodgers at Giants 2022 MLB Baseball, is broadcasted on Roku.
- Online streaming: Sign up for Fubo.
Scoring Summary
 |
11th Inning | Flores flied out to left. |
 |
11th Inning | Matos popped out to third. |
 |
11th Inning | Chapman struck out swinging. |
 |
11th Inning | Edman grounded out to shortstop. |
 |
11th Inning | Pages stole second. |
 |
11th Inning | Pages singled to right, Freeman scored, T. Hernández to third. |
Statistics
 LAD LAD |
 SF SF |
|
|---|---|---|
| 1 | Games Played | 1 |
| 1 | Team Games Played | 1 |
| 0 | Hit By Pitch | 0 |
| 9 | Ground Balls | 10 |
| 12 | Strikeouts | 11 |
| 5 | Runs Batted In | 2 |
| 0 | Sacrifice Hit | 0 |
| 6 | Hits | 5 |
| 1 | Stolen Bases | 0 |
| 4 | Walks | 4 |
| 0 | Catcher Interference | 0 |
| 5 | Runs | 2 |
| 0 | Ground Into Double Play | 0 |
| 0 | Sacrifice Flies | 0 |
| 39 | At Bats | 38 |
| 1 | Home Runs | 1 |
| 0 | Grand Slam Home Runs | 0 |
| 19 | Runners Left On Base | 16 |
| 0 | Triples | 0 |
| 1 | Game Winning RBIs | 0 |
| 1 | Intentional Walks | 1 |
| 1 | Doubles | 1 |
| 18 | Fly Balls | 17 |
| 0 | Caught Stealing | 0 |
| 168 | Pitches | 152 |
| 0 | Games Started | 0 |
| 2 | Pinch At Bats | 1 |
| 0 | Pinch Hits | 1 |
| 0.0 | Player Rating | 0.0 |
| 1 | Is Qualified | 1 |
| 1 | Is Qualified In Steals | 0 |
| 10 | Total Bases | 9 |
| 43 | Plate Appearances | 42 |
| 162.0 | Projected Home Runs | 162.0 |
| 2 | Extra Base Hits | 2 |
| 2.3 | Runs Created | 1.6 |
| .154 | Batting Average | .132 |
| .000 | Pinch Hit Average | 1.000 |
| .256 | Slugging Percentage | .237 |
| .231 | Secondary Average | .211 |
| .233 | On Base Percentage | .214 |
| .489 | OBP Pct + SLG Pct | .451 |
| 0.5 | Ground To Fly Ball Ratio | 0.6 |
| 1.9 | Runs Created Per 27 Outs | 1.3 |
| 32.0 | Batter Rating | 18.0 |
| 39.0 | At Bats Per Home Run | 38.0 |
| 1.00 | Stolen Base Percentage | 0.00 |
| 3.91 | Pitches Per Plate Appearance | 3.62 |
| .103 | Isolated Power | .105 |
| 0.33 | Walk To Strikeout Ratio | 0.36 |
| .093 | Walks Per Plate Appearance | .095 |
| .077 | Secondary Average Minus Batting Average | .079 |
| 10.0 | Runs Produced | 4.0 |
| 1.0 | Runs Ratio | 1.0 |
| 0.3 | Patience Ratio | 0.3 |
| 0.2 | Balls In Play Average | 0.2 |
| 75.0 | MLB Rating | 67.0 |
| 0.0 | Offensive Wins Above Replacement | 0.0 |
| 0.0 | Wins Above Replacement | 0.0 |
Game Information

Location: San Francisco, California
Attendance: 41,048 | Capacity:
2025 National League West Standings
| TEAM | W | L | PCT | GB | STRK |
|---|---|---|---|---|---|
 Los Angeles Los Angeles |
58 | 39 | .598 | - | W2 |
 San Diego San Diego |
52 | 44 | .542 | 5.5 | L1 |
 San Francisco San Francisco |
52 | 45 | .536 | 6 | L2 |
 Arizona Arizona |
47 | 50 | .485 | 11 | W1 |
 Colorado Colorado |
22 | 74 | .229 | 35.5 | L2 |