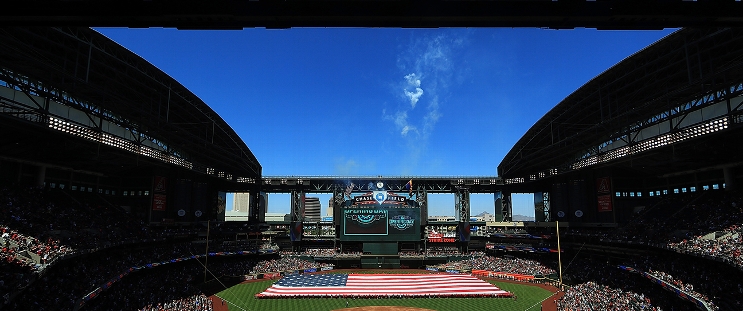
St. Louis Cardinals at Arizona Diamondbacks
· Major League Baseball
St. Louis Cardinals
47-41, 21-24 Awayvs

Arizona Diamondbacks
43-44, 22-23 HomeHow To Watch
How can I watch St. Louis Cardinals vs. Arizona Diamondbacks?
- TV Channel: Cardinals at Diamondbacks 2022 MLB Baseball, is broadcasted on FanDuel SN MW.
- Online streaming: Sign up for Fubo.
Matchup Prediction
Diamondbacks: 54.4%
Cardinals: 45.6%
*According to ESPN's Basketball Power Index
Statistics
 STL STL |
 ARI ARI |
|
|---|---|---|
| 88 | Games Played | 86 |
| 88 | Team Games Played | 86 |
| 46 | Hit By Pitch | 39 |
| 934 | Ground Balls | 965 |
| 682 | Strikeouts | 676 |
| 383 | Runs Batted In | 439 |
| 9 | Sacrifice Hit | 15 |
| 754 | Hits | 747 |
| 47 | Stolen Bases | 62 |
| 276 | Walks | 305 |
| 1 | Catcher Interference | 1 |
| 403 | Runs | 449 |
| 61 | Ground Into Double Play | 59 |
| 25 | Sacrifice Flies | 36 |
| 2985 | At Bats | 2927 |
| 87 | Home Runs | 128 |
| 0 | Grand Slam Home Runs | 8 |
| 0 | Runners Left On Base | 0 |
| 4 | Triples | 18 |
| 46 | Game Winning RBIs | 43 |
| 12 | Intentional Walks | 9 |
| 151 | Doubles | 151 |
| 1403 | Fly Balls | 1337 |
| 15 | Caught Stealing | 19 |
| 12918 | Pitches | 12817 |
| 88 | Games Started | 86 |
| 39 | Pinch At Bats | 66 |
| 11 | Pinch Hits | 16 |
| 0.0 | Player Rating | 0.0 |
| 1 | Is Qualified | 1 |
| 1 | Is Qualified In Steals | 1 |
| 1174 | Total Bases | 1318 |
| 3342 | Plate Appearances | 3323 |
| 160.0 | Projected Home Runs | 241.0 |
| 242 | Extra Base Hits | 297 |
| 384.7 | Runs Created | 442.4 |
| .253 | Batting Average | .255 |
| .282 | Pinch Hit Average | .242 |
| .393 | Slugging Percentage | .450 |
| .244 | Secondary Average | .314 |
| .323 | On Base Percentage | .330 |
| .716 | OBP Pct + SLG Pct | .780 |
| 0.7 | Ground To Fly Ball Ratio | 0.7 |
| 4.4 | Runs Created Per 27 Outs | 5.2 |
| 2946.0 | Batter Rating | 3316.0 |
| 34.3 | At Bats Per Home Run | 22.9 |
| 0.76 | Stolen Base Percentage | 0.77 |
| 3.87 | Pitches Per Plate Appearance | 3.86 |
| .141 | Isolated Power | .195 |
| 0.40 | Walk To Strikeout Ratio | 0.45 |
| .083 | Walks Per Plate Appearance | .092 |
| -.009 | Secondary Average Minus Batting Average | .059 |
| 786.0 | Runs Produced | 888.0 |
| 1.0 | Runs Ratio | 1.0 |
| 0.5 | Patience Ratio | 0.5 |
| 0.3 | Balls In Play Average | 0.3 |
| 2141.8 | MLB Rating | 2407.5 |
| 0.0 | Offensive Wins Above Replacement | 0.0 |
| 0.0 | Wins Above Replacement | 0.0 |
Game Information

Chase Field
Location: Phoenix, Arizona
Capacity:
2025 National League Central Standings
| TEAM | W | L | PCT | GB | STRK |
|---|---|---|---|---|---|
 Chicago Chicago |
52 | 35 | .598 | - | W3 |
 Milwaukee Milwaukee |
48 | 39 | .552 | 4 | L2 |
 St. Louis St. Louis |
47 | 41 | .534 | 5.5 | L3 |
 Cincinnati Cincinnati |
45 | 42 | .517 | 7 | W1 |
 Pittsburgh Pittsburgh |
38 | 50 | .432 | 14.5 | W6 |
2025 National League West Standings
| TEAM | W | L | PCT | GB | STRK |
|---|---|---|---|---|---|
 Los Angeles Los Angeles |
56 | 32 | .636 | - | W4 |
 San Diego San Diego |
46 | 40 | .535 | 9 | L1 |
 San Francisco San Francisco |
47 | 41 | .534 | 9 | W2 |
 Arizona Arizona |
43 | 44 | .494 | 12.5 | L2 |
 Colorado Colorado |
20 | 67 | .230 | 35.5 | W1 |
Diamondbacks Last 5
| Date | OPP | Result |
|---|---|---|
vs  MIA MIA |
L 6-4 | |
vs  SF SF |
W 4-2 | |
vs  SF SF |
W 8-2 | |
vs  SF SF |
L 6-5 F/10 | |
vs  SF SF |
L 7-2 |
 CLE
CLE