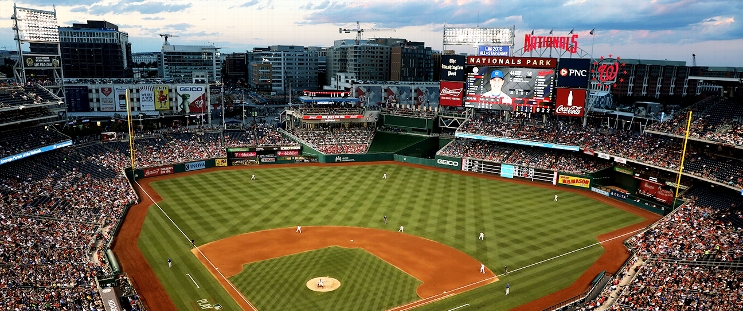
Cincinnati Reds at Washington Nationals
· Major League Baseball
Cincinnati Reds
46-42, 22-23 Awayvs

Washington Nationals
37-51, 18-26 HomeHow To Watch
How can I watch Cincinnati Reds vs. Washington Nationals?
- TV Channel: Reds at Nationals 2022 MLB Baseball, is broadcasted on MLBN.
- Online streaming: Sign up for Fubo.
Matchup Prediction
Nationals: 44.3%
Reds: 55.7%
*According to ESPN's Basketball Power Index
Statistics
 CIN CIN |
 WSH WSH |
|
|---|---|---|
| 88 | Games Played | 88 |
| 88 | Team Games Played | 88 |
| 29 | Hit By Pitch | 38 |
| 0 | Ground Balls | 0 |
| 767 | Strikeouts | 668 |
| 392 | Runs Batted In | 374 |
| 7 | Sacrifice Hit | 16 |
| 733 | Hits | 729 |
| 66 | Stolen Bases | 78 |
| 295 | Walks | 258 |
| 0 | Catcher Interference | 1 |
| 413 | Runs | 390 |
| 58 | Ground Into Double Play | 54 |
| 23 | Sacrifice Flies | 21 |
| 2955 | At Bats | 2959 |
| 94 | Home Runs | 87 |
| 6 | Grand Slam Home Runs | 0 |
| 575 | Runners Left On Base | 559 |
| 11 | Triples | 12 |
| 0 | Game Winning RBIs | 0 |
| 7 | Intentional Walks | 10 |
| 145 | Doubles | 144 |
| 0 | Fly Balls | 0 |
| 23 | Caught Stealing | 30 |
| 12909 | Pitches | 12461 |
| 0 | Games Started | 0 |
| 0 | Pinch At Bats | 0 |
| 0 | Pinch Hits | 0 |
| 0.0 | Player Rating | 0.0 |
| 1 | Is Qualified | 1 |
| 1 | Is Qualified In Steals | 1 |
| 1182 | Total Bases | 1158 |
| 3309 | Plate Appearances | 3293 |
| 173.0 | Projected Home Runs | 160.0 |
| 250 | Extra Base Hits | 243 |
| 384.1 | Runs Created | 367.8 |
| .248 | Batting Average | .246 |
| .000 | Pinch Hit Average | .000 |
| .400 | Slugging Percentage | .391 |
| .266 | Secondary Average | .248 |
| .320 | On Base Percentage | .313 |
| .720 | OBP Pct + SLG Pct | .704 |
| 0.0 | Ground To Fly Ball Ratio | 0.0 |
| 4.4 | Runs Created Per 27 Outs | 4.2 |
| 3008.5 | Batter Rating | 2914.0 |
| 31.4 | At Bats Per Home Run | 34.0 |
| 0.74 | Stolen Base Percentage | 0.72 |
| 3.90 | Pitches Per Plate Appearance | 3.78 |
| .152 | Isolated Power | .145 |
| 0.38 | Walk To Strikeout Ratio | 0.39 |
| .089 | Walks Per Plate Appearance | .078 |
| .018 | Secondary Average Minus Batting Average | .002 |
| 805.0 | Runs Produced | 764.0 |
| 0.9 | Runs Ratio | 1.0 |
| 0.5 | Patience Ratio | 0.5 |
| 0.3 | Balls In Play Average | 0.3 |
| 2131.0 | MLB Rating | 2080.8 |
| 0.0 | Offensive Wins Above Replacement | 0.0 |
| 0.0 | Wins Above Replacement | 0.0 |
Game Information

Nationals Park
Location: Washington, District of Columbia
Capacity:
2025 National League Central Standings
| TEAM | W | L | PCT | GB | STRK |
|---|---|---|---|---|---|
 Chicago Chicago |
53 | 35 | .602 | - | W4 |
 Milwaukee Milwaukee |
49 | 39 | .557 | 4 | W1 |
 St. Louis St. Louis |
47 | 42 | .528 | 6.5 | L4 |
 Cincinnati Cincinnati |
46 | 42 | .523 | 7 | W2 |
 Pittsburgh Pittsburgh |
38 | 51 | .427 | 15.5 | L1 |
2025 National League East Standings
| TEAM | W | L | PCT | GB | STRK |
|---|---|---|---|---|---|
 Philadelphia Philadelphia |
51 | 37 | .580 | - | L1 |
 New York New York |
51 | 38 | .573 | 0.5 | W3 |
 Miami Miami |
39 | 47 | .453 | 11 | L1 |
 Atlanta Atlanta |
39 | 48 | .448 | 11.5 | L2 |
 Washington Washington |
37 | 51 | .420 | 14 | L1 |
Nationals Last 5
| Date | OPP | Result |
|---|---|---|
@  LAA LAA |
W 7-4 F/11 | |
vs  DET DET |
L 11-2 | |
vs  DET DET |
W 9-4 | |
vs  DET DET |
W 11-7 | |
vs  BOS BOS |
L 11-2 |
 SD
SD