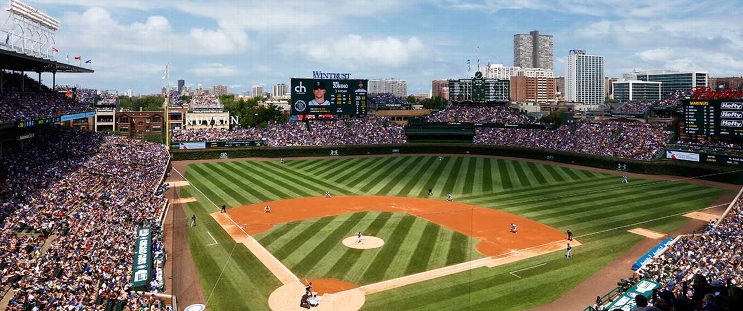
Baltimore Orioles at Chicago Cubs
· Major League Baseball
Baltimore Orioles
43-52, 21-27 Awayvs

Chicago Cubs
57-39, 30-16 HomeHow To Watch
How can I watch Baltimore Orioles vs. Chicago Cubs?
- TV Channel: Orioles at Cubs 2022 MLB Baseball, is broadcasted on MAS+.
- Online streaming: Sign up for Fubo.
Matchup Prediction
Cubs: 72.3%
Orioles: 27.7%
*According to ESPN's Basketball Power Index
Statistics
 BAL BAL |
 CHC CHC |
|
|---|---|---|
| 95 | Games Played | 96 |
| 95 | Team Games Played | 96 |
| 45 | Hit By Pitch | 24 |
| 1017 | Ground Balls | 1000 |
| 831 | Strikeouts | 743 |
| 371 | Runs Batted In | 501 |
| 3 | Sacrifice Hit | 7 |
| 760 | Hits | 849 |
| 67 | Stolen Bases | 108 |
| 264 | Walks | 331 |
| 0 | Catcher Interference | 1 |
| 393 | Runs | 512 |
| 67 | Ground Into Double Play | 39 |
| 25 | Sacrifice Flies | 29 |
| 3176 | At Bats | 3321 |
| 111 | Home Runs | 142 |
| 3 | Grand Slam Home Runs | 3 |
| 0 | Runners Left On Base | 0 |
| 10 | Triples | 20 |
| 43 | Game Winning RBIs | 55 |
| 9 | Intentional Walks | 10 |
| 150 | Doubles | 166 |
| 1356 | Fly Balls | 1614 |
| 22 | Caught Stealing | 19 |
| 13818 | Pitches | 14417 |
| 95 | Games Started | 96 |
| 47 | Pinch At Bats | 50 |
| 11 | Pinch Hits | 11 |
| 0.0 | Player Rating | 0.0 |
| 1 | Is Qualified | 1 |
| 1 | Is Qualified In Steals | 1 |
| 1263 | Total Bases | 1481 |
| 3513 | Plate Appearances | 3713 |
| 189.0 | Projected Home Runs | 240.0 |
| 271 | Extra Base Hits | 328 |
| 385.0 | Runs Created | 504.2 |
| .239 | Batting Average | .256 |
| .234 | Pinch Hit Average | .220 |
| .398 | Slugging Percentage | .446 |
| .256 | Secondary Average | .317 |
| .305 | On Base Percentage | .325 |
| .702 | OBP Pct + SLG Pct | .771 |
| 0.8 | Ground To Fly Ball Ratio | 0.6 |
| 4.1 | Runs Created Per 27 Outs | 5.3 |
| 3013.0 | Batter Rating | 3791.0 |
| 28.6 | At Bats Per Home Run | 23.4 |
| 0.75 | Stolen Base Percentage | 0.85 |
| 3.93 | Pitches Per Plate Appearance | 3.88 |
| .158 | Isolated Power | .190 |
| 0.32 | Walk To Strikeout Ratio | 0.45 |
| .075 | Walks Per Plate Appearance | .089 |
| .016 | Secondary Average Minus Batting Average | .061 |
| 764.0 | Runs Produced | 1013.0 |
| 0.9 | Runs Ratio | 1.0 |
| 0.5 | Patience Ratio | 0.5 |
| 0.3 | Balls In Play Average | 0.3 |
| 2129.8 | MLB Rating | 2718.3 |
| 0.0 | Offensive Wins Above Replacement | 0.0 |
| 0.0 | Wins Above Replacement | 0.0 |
Game Information

Wrigley Field
Location: Chicago, Illinois
Capacity:
2025 American League East Standings
| TEAM | W | L | PCT | GB | STRK |
|---|---|---|---|---|---|
 Toronto Toronto |
55 | 41 | .573 | - | L2 |
 New York New York |
53 | 43 | .552 | 2 | L2 |
 Boston Boston |
53 | 45 | .541 | 3 | W10 |
 Tampa Bay Tampa Bay |
50 | 47 | .515 | 5.5 | L4 |
 Baltimore Baltimore |
43 | 52 | .453 | 11.5 | L2 |
2025 National League Central Standings
| TEAM | W | L | PCT | GB | STRK |
|---|---|---|---|---|---|
 Chicago Chicago |
57 | 39 | .594 | - | W2 |
 Milwaukee Milwaukee |
56 | 40 | .583 | 1 | W7 |
 St. Louis St. Louis |
51 | 46 | .526 | 6.5 | W1 |
 Cincinnati Cincinnati |
50 | 47 | .515 | 7.5 | W2 |
 Pittsburgh Pittsburgh |
39 | 58 | .402 | 18.5 | W1 |
 NYM
NYM MIA
MIA MIN
MIN