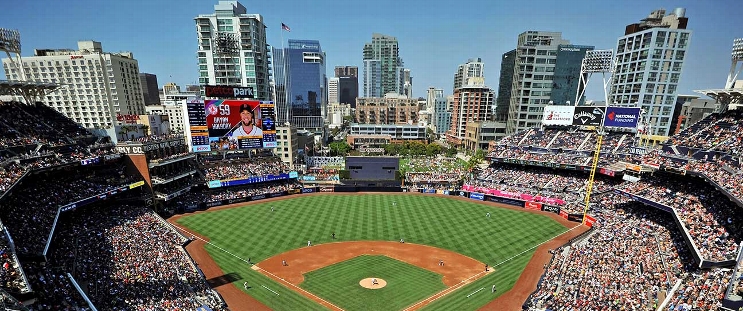
Boston Red Sox at San Diego Padres
· Major League Baseball
10 - 2

Abreu homers off Pivetta to help the Red Sox beat the Padres, 10-2

Connor Wong added a bases-loaded double and Walker Buehler (7-6) shut out the Padres on four singles through six innings as the Red Sox won for the 10th time in 12 games. Buehler struck out four and walked two, with only two Padres reaching scoring position.
Buehler improved to 7-1 against the Padres and 2-1 at Petco Park. His previous 12 starts against San Diego all came while with the NL West-rival Los Angeles Dodgers.
Buehler, who earned the save in the Dodgers' World Series-ending Game 5 victory over the Yankees, signed with the Red Sox as a free agent Dec. 28.
Pivetta (11-4) loaded the bases opening the fourth by allowing a single to Alex Bregman and walking Jarren Duran and Trevor Story. Yoshida hit a sacrifice fly and Pivetta's errant throw trying to pick off Story brought in another run.
With two outs, Abreu hit a 423-foot homer to right-center, his 21st, to make it 4-0.
Bregman hit a sac fly in the fifth.
Pivetta allowed five runs and five hits in six innings, struck out three and walked three.
Wong’s three-run double off Sean Reynolds made it 8-0 in the eighth. The Padres scored twice in the bottom of the inning.
Yoshida hit a two-run homer in the ninth off Reynolds, his second.
How can I watch Boston Red Sox vs. San Diego Padres?
- TV Channel: Red Sox at Padres 2022 MLB Baseball, is broadcasted on MLB.TV.
- Online streaming: Sign up for Fubo.
Scoring Summary
 |
9th Inning | Iglesias grounded out to shortstop. |
 |
9th Inning | Johnson grounded out to shortstop. |
 |
9th Inning | Sheets grounded out to pitcher. |
 |
9th Inning | Campbell relieved Whitlock |
 |
9th Inning | Sheets hit for Machado |
 |
9th Inning | Wong grounded into fielder's choice to shortstop, Toro out at second. |
Statistics
 BOS BOS |
 SD SD |
|
|---|---|---|
| 1 | Games Played | 1 |
| 1 | Team Games Played | 1 |
| 1 | Hit By Pitch | 1 |
| 8 | Ground Balls | 14 |
| 4 | Strikeouts | 6 |
| 9 | Runs Batted In | 2 |
| 0 | Sacrifice Hit | 0 |
| 10 | Hits | 6 |
| 0 | Stolen Bases | 0 |
| 8 | Walks | 7 |
| 0 | Catcher Interference | 0 |
| 10 | Runs | 2 |
| 0 | Ground Into Double Play | 0 |
| 1 | Sacrifice Flies | 0 |
| 35 | At Bats | 33 |
| 2 | Home Runs | 0 |
| 0 | Grand Slam Home Runs | 0 |
| 18 | Runners Left On Base | 22 |
| 0 | Triples | 0 |
| 1 | Game Winning RBIs | 0 |
| 0 | Intentional Walks | 0 |
| 2 | Doubles | 0 |
| 24 | Fly Balls | 13 |
| 0 | Caught Stealing | 0 |
| 174 | Pitches | 168 |
| 0 | Games Started | 0 |
| 0 | Pinch At Bats | 1 |
| 0 | Pinch Hits | 0 |
| 0.0 | Player Rating | 0.0 |
| 1 | Is Qualified | 1 |
| 0 | Is Qualified In Steals | 0 |
| 18 | Total Bases | 6 |
| 45 | Plate Appearances | 41 |
| 324.0 | Projected Home Runs | 0.0 |
| 4 | Extra Base Hits | 0 |
| 8.3 | Runs Created | 3.0 |
| .286 | Batting Average | .182 |
| .000 | Pinch Hit Average | .000 |
| .514 | Slugging Percentage | .182 |
| .457 | Secondary Average | .212 |
| .422 | On Base Percentage | .341 |
| .937 | OBP Pct + SLG Pct | .523 |
| 0.3 | Ground To Fly Ball Ratio | 1.1 |
| 8.7 | Runs Created Per 27 Outs | 3.0 |
| 58.0 | Batter Rating | 14.0 |
| 17.5 | At Bats Per Home Run | 0.0 |
| 0.00 | Stolen Base Percentage | 0.00 |
| 3.87 | Pitches Per Plate Appearance | 4.10 |
| .229 | Isolated Power | .000 |
| 2.00 | Walk To Strikeout Ratio | 1.17 |
| .178 | Walks Per Plate Appearance | .171 |
| .171 | Secondary Average Minus Batting Average | .030 |
| 19.0 | Runs Produced | 4.0 |
| 0.9 | Runs Ratio | 1.0 |
| 0.7 | Patience Ratio | 0.3 |
| 0.3 | Balls In Play Average | 0.2 |
| 101.3 | MLB Rating | 68.8 |
| 0.0 | Offensive Wins Above Replacement | 0.0 |
| 0.0 | Wins Above Replacement | 0.0 |
Game Information

Location: San Diego, California
Attendance: 44,061 | Capacity: