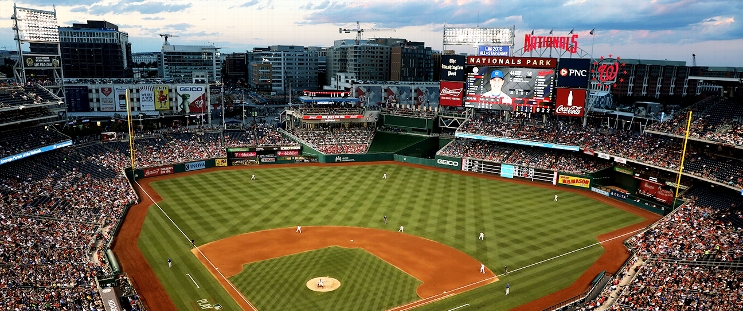
New York Mets at Washington Nationals
· Major League Baseball
4 - 5

Josh Bell's homer, rookie Cole Henry's clutch relief help Nationals beat Mets 5-4

Bell's 16th homer was a 420-foot line drive to the right-field stands in the fifth against the struggling Kodai Senga (7-5), who allowed five funs (four earned) in five-plus innings.
New York's Brett Baty hit his 15th homer, a 455-foot rocket in the fifth. Nationals right fielder Dylan Crews stood still as the ball flew into the second deck.
Rookie Brad Lord (4-6) pitched five sharp innings for the Nationals before losing his command in the sixth. He walked the first two batters, then gave up back-to-back one-out doubles to Pete Alonso and Jeff McNeil that got the Mets within 5-4. Henry came in and worked around a throwing error by third baseman Paul DeJong, retiring Cedric Mullins on a popup and Luis Torrens on a grounder to strand the bases loaded.
Shinnosuke Ogasawara pitched a perfect seventh, Clayton Beeter did the same in the eighth and Jose A. Ferrer worked the ninth for his third save.
Nationals interim manager Miguel Cairo was ejected by plate umpire Todd Tichenor in the top of the sixth.
Mets left fielder Brandon Nimmo exited in the second inning with a stiff neck.
How can I watch New York Mets vs. Washington Nationals?
- TV Channel: Mets at Nationals 2022 MLB Baseball, is broadcasted on MLB.TV.
- Online streaming: Sign up for Fubo.
Scoring Summary
 |
9th Inning | Torrens grounded into double play, second to shortstop to first, Mullins out at second. |
 |
9th Inning | Mullins reached on infield single to pitcher. |
 |
9th Inning | Baty grounded out to shortstop. |
 |
9th Inning | Ferrer relieved Beeter |
 |
8th Inning | Crews grounded into fielder's choice to second, Lile out at second. |
 |
8th Inning | Lile walked. |
Statistics
 NYM NYM |
 WSH WSH |
|
|---|---|---|
| 1 | Games Played | 1 |
| 1 | Team Games Played | 1 |
| 0 | Hit By Pitch | 0 |
| 18 | Ground Balls | 12 |
| 5 | Strikeouts | 5 |
| 4 | Runs Batted In | 5 |
| 0 | Sacrifice Hit | 0 |
| 8 | Hits | 7 |
| 0 | Stolen Bases | 0 |
| 3 | Walks | 3 |
| 0 | Catcher Interference | 1 |
| 4 | Runs | 5 |
| 3 | Ground Into Double Play | 1 |
| 0 | Sacrifice Flies | 1 |
| 33 | At Bats | 29 |
| 1 | Home Runs | 1 |
| 0 | Grand Slam Home Runs | 0 |
| 15 | Runners Left On Base | 11 |
| 0 | Triples | 1 |
| 0 | Game Winning RBIs | 1 |
| 0 | Intentional Walks | 0 |
| 3 | Doubles | 2 |
| 10 | Fly Balls | 13 |
| 0 | Caught Stealing | 0 |
| 138 | Pitches | 116 |
| 0 | Games Started | 0 |
| 0 | Pinch At Bats | 0 |
| 0 | Pinch Hits | 0 |
| 0.0 | Player Rating | 0.0 |
| 1 | Is Qualified | 1 |
| 0 | Is Qualified In Steals | 0 |
| 14 | Total Bases | 14 |
| 36 | Plate Appearances | 34 |
| 162.0 | Projected Home Runs | 162.0 |
| 4 | Extra Base Hits | 4 |
| 3.3 | Runs Created | 4.2 |
| .242 | Batting Average | .241 |
| .000 | Pinch Hit Average | .000 |
| .424 | Slugging Percentage | .483 |
| .273 | Secondary Average | .345 |
| .306 | On Base Percentage | .303 |
| .730 | OBP Pct + SLG Pct | .786 |
| 1.8 | Ground To Fly Ball Ratio | 0.9 |
| 3.2 | Runs Created Per 27 Outs | 4.7 |
| 33.0 | Batter Rating | 36.5 |
| 33.0 | At Bats Per Home Run | 29.0 |
| 0.00 | Stolen Base Percentage | 0.00 |
| 3.83 | Pitches Per Plate Appearance | 3.41 |
| .182 | Isolated Power | .241 |
| 0.60 | Walk To Strikeout Ratio | 0.60 |
| .083 | Walks Per Plate Appearance | .088 |
| .030 | Secondary Average Minus Batting Average | .103 |
| 8.0 | Runs Produced | 10.0 |
| 1.0 | Runs Ratio | 1.0 |
| 0.5 | Patience Ratio | 0.5 |
| 0.3 | Balls In Play Average | 0.3 |
| 82.3 | MLB Rating | 84.3 |
| 0.0 | Offensive Wins Above Replacement | 0.0 |
| 0.0 | Wins Above Replacement | 0.0 |
Game Information

Location: Washington, District of Columbia
Attendance: 19,565 | Capacity: