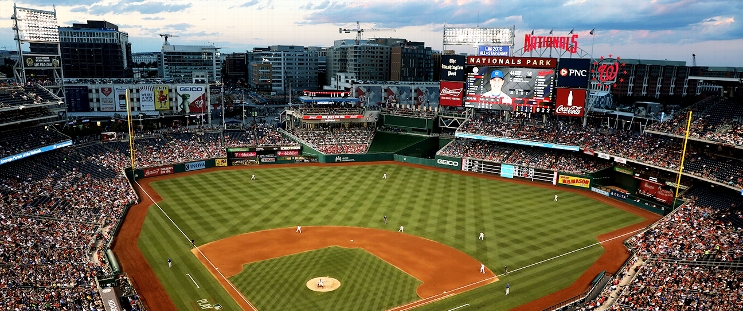
New York Mets at Washington Nationals
· Major League Baseball
3 - 9

James Wood hits a 3-run homer and the Nationals beat the banged-up Mets 9-3 to win series

Wood’s opposite-field shot to left in the ninth was his 26th homer of the season but just his second since the second-year slugger played in his first All-Star Game.
Rookie Brady House had three hits and an RBI for the Nationals, who got another strong performance from their inexperienced bullpen after All-Star MacKenzie Gore couldn't get through the fifth. Jackson Rutledge (2-2), Clayton Beeter, PJ Poulin, Cole Henry and Jose A. Ferrer combined to allow one hit in 4 2/3 innings, with Ferrer getting the last four outs for his fourth save.
Francisco Lindor broke the Mets' franchise record for leadoff homers in a season with his eighth. It was his 25th homer of the season and 28th career leadoff shot.
Starling Marte also homered for the Mets, who didn't have regulars Brandon Nimmo and Jeff McNeil in the lineup due to nagging injuries. McNeil struck out looking as a pinch-hitter in the eighth.
New York has lost 16 of 21 and fell seven games behind first-place Philadelphia in the division.
Cade Cavalli (1-0, 2.20) starts Washington's series opener Friday at Philadelphia, which counters with Taijuan Walker (4-6, 3.34).
How can I watch New York Mets vs. Washington Nationals?
- TV Channel: Mets at Nationals 2022 MLB Baseball, is broadcasted on MLB.TV.
- Online streaming: Sign up for Fubo.
Scoring Summary
 |
9th Inning | J. Soto struck out swinging. |
 |
9th Inning | Lindor to second on fielder's indifference. |
 |
9th Inning | Lindor singled to right. |
 |
9th Inning | Senger struck out swinging. |
 |
9th Inning | Mullins grounded out to first. |
 |
9th Inning | Hassell III in left field. |
Statistics
 NYM NYM |
 WSH WSH |
|
|---|---|---|
| 1 | Games Played | 1 |
| 1 | Team Games Played | 1 |
| 0 | Hit By Pitch | 2 |
| 9 | Ground Balls | 7 |
| 11 | Strikeouts | 14 |
| 3 | Runs Batted In | 9 |
| 0 | Sacrifice Hit | 1 |
| 7 | Hits | 9 |
| 0 | Stolen Bases | 1 |
| 5 | Walks | 3 |
| 0 | Catcher Interference | 0 |
| 3 | Runs | 9 |
| 0 | Ground Into Double Play | 0 |
| 1 | Sacrifice Flies | 1 |
| 32 | At Bats | 32 |
| 2 | Home Runs | 1 |
| 0 | Grand Slam Home Runs | 0 |
| 13 | Runners Left On Base | 16 |
| 0 | Triples | 0 |
| 0 | Game Winning RBIs | 1 |
| 0 | Intentional Walks | 0 |
| 0 | Doubles | 1 |
| 13 | Fly Balls | 13 |
| 1 | Caught Stealing | 0 |
| 172 | Pitches | 161 |
| 0 | Games Started | 0 |
| 1 | Pinch At Bats | 0 |
| 0 | Pinch Hits | 0 |
| 0.0 | Player Rating | 0.0 |
| 1 | Is Qualified | 1 |
| 1 | Is Qualified In Steals | 1 |
| 13 | Total Bases | 13 |
| 38 | Plate Appearances | 39 |
| 324.0 | Projected Home Runs | 162.0 |
| 2 | Extra Base Hits | 2 |
| 4.2 | Runs Created | 5.5 |
| .219 | Batting Average | .281 |
| .000 | Pinch Hit Average | .000 |
| .406 | Slugging Percentage | .406 |
| .313 | Secondary Average | .250 |
| .316 | On Base Percentage | .368 |
| .722 | OBP Pct + SLG Pct | .775 |
| 0.7 | Ground To Fly Ball Ratio | 0.5 |
| 4.2 | Runs Created Per 27 Outs | 6.0 |
| 25.0 | Batter Rating | 51.0 |
| 16.0 | At Bats Per Home Run | 32.0 |
| 0.00 | Stolen Base Percentage | 1.00 |
| 4.53 | Pitches Per Plate Appearance | 4.13 |
| .188 | Isolated Power | .125 |
| 0.45 | Walk To Strikeout Ratio | 0.21 |
| .132 | Walks Per Plate Appearance | .077 |
| .094 | Secondary Average Minus Batting Average | -.031 |
| 6.0 | Runs Produced | 18.0 |
| 1.0 | Runs Ratio | 1.0 |
| 0.5 | Patience Ratio | 0.5 |
| 0.3 | Balls In Play Average | 0.5 |
| 77.3 | MLB Rating | 91.8 |
| 0.0 | Offensive Wins Above Replacement | 0.0 |
| 0.0 | Wins Above Replacement | 0.0 |
Game Information

Location: Washington, District of Columbia
Attendance: 20,127 | Capacity: