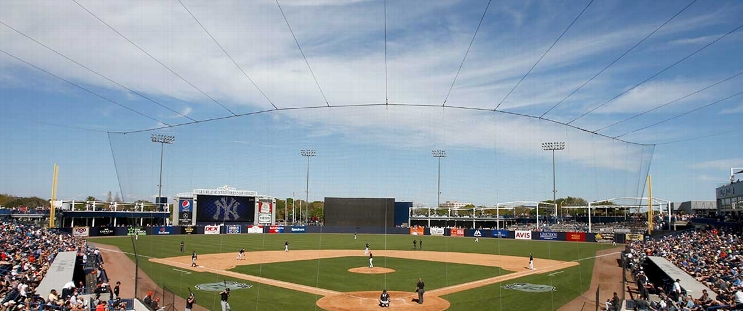
St. Louis Cardinals at Tampa Bay Rays
· Major League Baseball
6 - 10

Carson Williams homers in his big league debut as Rays beat Cardinals 10-6

Williams' drive to center in the seventh inning made it 9-6 and set off a raucous celebration by his family in the stands. He also had an RBI infield single in the third. The 22-year-old shortstop was the Rays' top-rated prospect when he was called up on Thursday.
Brandon Lowe and Tristan Gray also homered for the Rays, and Jake Mangum had three hits and two RBI.
Rookie Nathan Church hit a two-run homer for the Cardinals in the seventh for his first career hit. Willson Contreras hit a two-run drive later in the inning to get St. Louis within 7-6.
Williams reached on a second-inning throwing error by Cardinals third baseman Nolan Gorman, who has five errors this month. The rookie's first hit came on a grounder that Gorman couldn't handle.
Adrian Houser (7-4) allowed four runs over 6 1/3 innings for the Rays. The Cardinals' Miles Mikolas (6-10) gave up 10 hits and five runs (four earned) in 2 2/3 innings.
Lowe's homer off Mikolas was his 25th, and Gray's was his first.
How can I watch St. Louis Cardinals vs. Tampa Bay Rays?
- TV Channel: Cardinals at Rays 2022 MLB Baseball, is broadcasted on MLB.TV.
- Online streaming: Sign up for Fubo.
Scoring Summary
 |
9th Inning | Contreras struck out swinging. |
 |
9th Inning | Herrera struck out swinging. |
 |
9th Inning | Nootbaar grounded out to second. |
 |
9th Inning | Fairbanks relieved Baker |
 |
8th Inning | Pereira grounded into double play, third to second to first, Mangum out at second. |
 |
8th Inning | Mangum singled to left, J. Lowe to third. |
Statistics
 STL STL |
 TB TB |
|
|---|---|---|
| 1 | Games Played | 1 |
| 1 | Team Games Played | 1 |
| 1 | Hit By Pitch | 1 |
| 17 | Ground Balls | 19 |
| 6 | Strikeouts | 6 |
| 6 | Runs Batted In | 10 |
| 0 | Sacrifice Hit | 0 |
| 9 | Hits | 16 |
| 0 | Stolen Bases | 3 |
| 2 | Walks | 3 |
| 0 | Catcher Interference | 0 |
| 6 | Runs | 10 |
| 0 | Ground Into Double Play | 1 |
| 0 | Sacrifice Flies | 0 |
| 36 | At Bats | 38 |
| 2 | Home Runs | 4 |
| 0 | Grand Slam Home Runs | 0 |
| 13 | Runners Left On Base | 17 |
| 0 | Triples | 0 |
| 0 | Game Winning RBIs | 1 |
| 0 | Intentional Walks | 0 |
| 1 | Doubles | 3 |
| 13 | Fly Balls | 13 |
| 0 | Caught Stealing | 2 |
| 144 | Pitches | 149 |
| 0 | Games Started | 0 |
| 0 | Pinch At Bats | 0 |
| 0 | Pinch Hits | 0 |
| 0.0 | Player Rating | 0.0 |
| 1 | Is Qualified | 1 |
| 0 | Is Qualified In Steals | 1 |
| 16 | Total Bases | 31 |
| 39 | Plate Appearances | 42 |
| 324.0 | Projected Home Runs | 648.0 |
| 3 | Extra Base Hits | 7 |
| 5.1 | Runs Created | 12.0 |
| .250 | Batting Average | .421 |
| .000 | Pinch Hit Average | .000 |
| .444 | Slugging Percentage | .816 |
| .250 | Secondary Average | .500 |
| .308 | On Base Percentage | .476 |
| .752 | OBP Pct + SLG Pct | 1.292 |
| 1.3 | Ground To Fly Ball Ratio | 1.5 |
| 5.1 | Runs Created Per 27 Outs | 13.0 |
| 41.0 | Batter Rating | 77.0 |
| 18.0 | At Bats Per Home Run | 9.5 |
| 0.00 | Stolen Base Percentage | 0.60 |
| 3.69 | Pitches Per Plate Appearance | 3.55 |
| .194 | Isolated Power | .395 |
| 0.33 | Walk To Strikeout Ratio | 0.50 |
| .051 | Walks Per Plate Appearance | .071 |
| .000 | Secondary Average Minus Batting Average | .079 |
| 12.0 | Runs Produced | 20.0 |
| 1.0 | Runs Ratio | 1.0 |
| 0.5 | Patience Ratio | 0.9 |
| 0.3 | Balls In Play Average | 0.4 |
| 88.5 | MLB Rating | 120.3 |
| 0.0 | Offensive Wins Above Replacement | 0.0 |
| 0.0 | Wins Above Replacement | 0.0 |
Game Information

Location: Tampa, Florida
Attendance: 10,046 | Capacity: