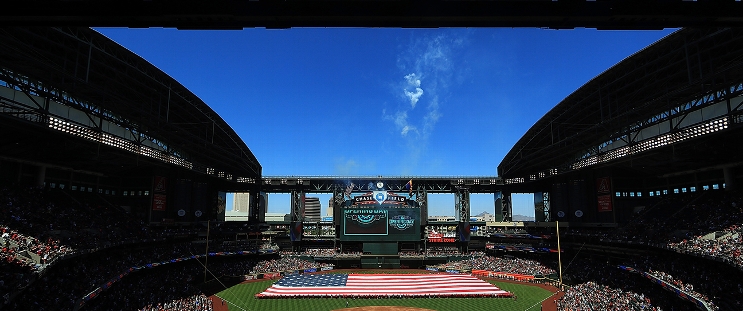
Cincinnati Reds at Arizona Diamondbacks
· Major League Baseball
5 - 6

Gurriel singles in winning run in the 11th in the Diamondbacks' 6-5 victory over the Reds

Gurriel led off the 11th and lifted a single into right-center off Scott Barlow (6-2) that easily scored the speedy Corbin Carroll, who started the inning on second base.
Cincinnati took a 5-4 lead in the top of the 10th, taking advantage of a throwing error by D-backs pitcher John Curtiss.
Carroll threw out Jose Trevino — trying to tag up and score on T.J. Friedl's foul fly to right — to keep it a one-run game. The throw was up the line, forcing Moreno to dive back to make the tag on his fellow catcher that withstood a replay challenge.
Arizona tied it on Ketel Marte's RBI single after a 13-pitch at-bat against Graham Ashcraft.
The Reds trailed 4-2 after three innings, but cut the deficit to 4-3 in the sixth on Austin Hays' RBI groundout that scored Elly De La Cruz, who reached on a leadoff triple. Cincinnati tied it up in the eighth on De La Cruz's RBI single.
Moreno hit his three-run homer after missing more than two months with a broken finger. His no-doubt shot to left came in the third inning and was his sixth of the season, giving the D-backs a 4-2 lead.
Arizona right-hander Ryne Nelson gave up three runs on four hits and two walks over six innings. He struck out six.
Jalen Beeks (4-1) earned the win with a scoreless 11th inning.
Cincinnati's Zack Littell had a short outing, needing 77 pitches to grind through three innings. He gave up four runs on four hits, striking out three and walking three.
How can I watch Cincinnati Reds vs. Arizona Diamondbacks?
- TV Channel: Reds at Diamondbacks 2022 MLB Baseball, is broadcasted on MLB.TV.
- Online streaming: Sign up for Fubo.
Scoring Summary
 |
11th Inning | Gurriel Jr. singled to center, Carroll scored. |
 |
11th Inning | Barlow relieved Ashcraft |
 |
11th Inning | De La Cruz lined into double play, shortstop to third, Friedl doubled off third. |
 |
11th Inning | Andujar grounded out to first, Friedl to third. |
 |
11th Inning | Beeks relieved Curtiss |
 |
10th Inning | Carroll grounded into double play, second to shortstop to first, Marte out at second. |
Statistics
 CIN CIN |
 ARI ARI |
|
|---|---|---|
| 1 | Games Played | 1 |
| 1 | Team Games Played | 1 |
| 0 | Hit By Pitch | 0 |
| 15 | Ground Balls | 5 |
| 7 | Strikeouts | 10 |
| 4 | Runs Batted In | 6 |
| 1 | Sacrifice Hit | 1 |
| 6 | Hits | 8 |
| 0 | Stolen Bases | 0 |
| 2 | Walks | 4 |
| 0 | Catcher Interference | 1 |
| 5 | Runs | 6 |
| 1 | Ground Into Double Play | 2 |
| 0 | Sacrifice Flies | 1 |
| 36 | At Bats | 33 |
| 0 | Home Runs | 1 |
| 0 | Grand Slam Home Runs | 0 |
| 12 | Runners Left On Base | 14 |
| 1 | Triples | 0 |
| 0 | Game Winning RBIs | 1 |
| 0 | Intentional Walks | 0 |
| 2 | Doubles | 1 |
| 15 | Fly Balls | 20 |
| 0 | Caught Stealing | 1 |
| 139 | Pitches | 167 |
| 0 | Games Started | 0 |
| 1 | Pinch At Bats | 0 |
| 1 | Pinch Hits | 0 |
| 0.0 | Player Rating | 0.0 |
| 1 | Is Qualified | 1 |
| 0 | Is Qualified In Steals | 1 |
| 10 | Total Bases | 12 |
| 39 | Plate Appearances | 40 |
| 0.0 | Projected Home Runs | 162.0 |
| 3 | Extra Base Hits | 2 |
| 1.5 | Runs Created | 3.1 |
| .167 | Batting Average | .242 |
| 1.000 | Pinch Hit Average | .000 |
| .278 | Slugging Percentage | .364 |
| .167 | Secondary Average | .212 |
| .211 | On Base Percentage | .316 |
| .488 | OBP Pct + SLG Pct | .679 |
| 1.0 | Ground To Fly Ball Ratio | 0.3 |
| 1.3 | Runs Created Per 27 Outs | 2.8 |
| 30.5 | Batter Rating | 37.0 |
| 0.0 | At Bats Per Home Run | 33.0 |
| 0.00 | Stolen Base Percentage | 0.00 |
| 3.56 | Pitches Per Plate Appearance | 4.18 |
| .111 | Isolated Power | .121 |
| 0.29 | Walk To Strikeout Ratio | 0.40 |
| .051 | Walks Per Plate Appearance | .100 |
| .000 | Secondary Average Minus Batting Average | -.030 |
| 9.0 | Runs Produced | 12.0 |
| 0.8 | Runs Ratio | 1.0 |
| 0.3 | Patience Ratio | 0.4 |
| 0.2 | Balls In Play Average | 0.3 |
| 75.5 | MLB Rating | 83.5 |
| 0.0 | Offensive Wins Above Replacement | 0.0 |
| 0.0 | Wins Above Replacement | 0.0 |
Game Information

Location: Phoenix, Arizona
Attendance: 29,252 | Capacity: