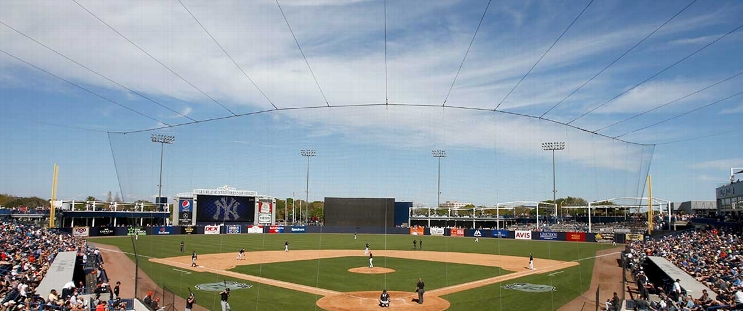
St. Louis Cardinals at Tampa Bay Rays
· Major League Baseball
2 - 7

Junior Caminero’s grand slam powers Rays to 7-2 win over Cardinals

The Rays (63-67) took two of three games in the series and are 5-5 over their last 10. The Cardinals (64-67) finished a 3-3 trip to Miami and Tampa.
Cardinals starter Matthew Liberatore, once a Rays prospect, walked Josh Lowe and Carson Williams to open the fifth inning. After getting one out, Liberatore issued another walk to Chandler Simpson that loaded the bases and ended his outing.
Matt Svanson entered and gave up Caminero’s 381-foot slam to right field on his first pitch.
The homer was Caminero’s 37th of the year, surpassing Alex Rodriguez for the most in one season by an American League player 21 or younger. Simpson added a two-run triple in the sixth to extend the lead to 7-0 and continue his strong rookie campaign.
Christopher Morel hit his 10th homer in the fourth to get the Rays going.
Liberatore (6-11) was charged with four runs on three hits and three walks in 4 2/3 innings. Ryan Pepiot (9-10) earned the win for Tampa Bay, throwing five scoreless innings while allowing one hit and one walk with three strikeouts.
How can I watch St. Louis Cardinals vs. Tampa Bay Rays?
- TV Channel: Cardinals at Rays 2022 MLB Baseball, is broadcasted on MLB.TV.
- Online streaming: Sign up for Fubo.
Scoring Summary
 |
9th Inning | Pozo struck out swinging. |
 |
9th Inning | Walker reached on infield single to third, Gorman to third. |
 |
9th Inning | Saggese flied out to center. |
 |
9th Inning | Gorman singled to center, Burleson scored. |
 |
9th Inning | Contreras struck out swinging. |
 |
9th Inning | Burleson to second on wild pitch by Van Belle. |
Statistics
 STL STL |
 TB TB |
|
|---|---|---|
| 1 | Games Played | 1 |
| 1 | Team Games Played | 1 |
| 0 | Hit By Pitch | 0 |
| 10 | Ground Balls | 9 |
| 8 | Strikeouts | 9 |
| 2 | Runs Batted In | 7 |
| 0 | Sacrifice Hit | 0 |
| 5 | Hits | 8 |
| 0 | Stolen Bases | 4 |
| 3 | Walks | 5 |
| 0 | Catcher Interference | 0 |
| 2 | Runs | 7 |
| 0 | Ground Into Double Play | 0 |
| 0 | Sacrifice Flies | 0 |
| 32 | At Bats | 31 |
| 0 | Home Runs | 2 |
| 0 | Grand Slam Home Runs | 1 |
| 11 | Runners Left On Base | 8 |
| 0 | Triples | 1 |
| 0 | Game Winning RBIs | 1 |
| 0 | Intentional Walks | 0 |
| 0 | Doubles | 1 |
| 14 | Fly Balls | 13 |
| 1 | Caught Stealing | 1 |
| 140 | Pitches | 133 |
| 0 | Games Started | 0 |
| 1 | Pinch At Bats | 0 |
| 0 | Pinch Hits | 0 |
| 0.0 | Player Rating | 0.0 |
| 1 | Is Qualified | 1 |
| 1 | Is Qualified In Steals | 1 |
| 5 | Total Bases | 17 |
| 35 | Plate Appearances | 36 |
| 0.0 | Projected Home Runs | 324.0 |
| 0 | Extra Base Hits | 4 |
| 0.4 | Runs Created | 6.7 |
| .156 | Batting Average | .258 |
| .000 | Pinch Hit Average | .000 |
| .156 | Slugging Percentage | .548 |
| .063 | Secondary Average | .548 |
| .229 | On Base Percentage | .361 |
| .385 | OBP Pct + SLG Pct | .909 |
| 0.7 | Ground To Fly Ball Ratio | 0.7 |
| 0.4 | Runs Created Per 27 Outs | 7.5 |
| 13.0 | Batter Rating | 50.5 |
| 0.0 | At Bats Per Home Run | 15.5 |
| 0.00 | Stolen Base Percentage | 0.80 |
| 4.00 | Pitches Per Plate Appearance | 3.69 |
| .000 | Isolated Power | .290 |
| 0.38 | Walk To Strikeout Ratio | 0.56 |
| .086 | Walks Per Plate Appearance | .139 |
| -.094 | Secondary Average Minus Batting Average | .290 |
| 4.0 | Runs Produced | 14.0 |
| 1.0 | Runs Ratio | 1.0 |
| 0.2 | Patience Ratio | 0.7 |
| 0.2 | Balls In Play Average | 0.3 |
| 64.8 | MLB Rating | 92.0 |
| 0.0 | Offensive Wins Above Replacement | 0.0 |
| 0.0 | Wins Above Replacement | 0.0 |
Game Information

Location: Tampa, Florida
Attendance: 8,809 | Capacity: