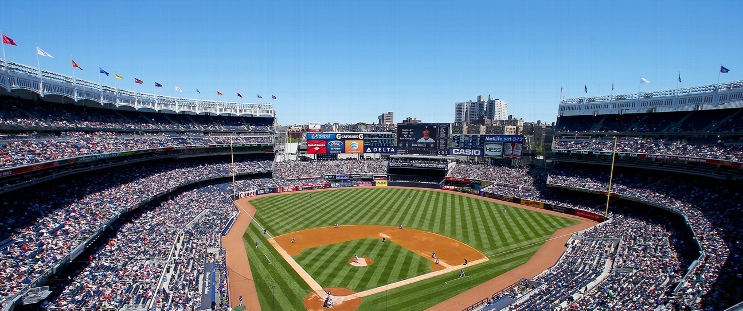
Washington Nationals at New York Yankees
· Major League Baseball
1 - 5

Stanton hits 451-foot homer, drives in 5 runs as Yankees beat Nationals 5-1

The Yankees won their third straight and remained a half-game behind Boston for the AL's top wild-card spot.
Stanton gave the Yankees a 5-1 lead when he lifted a slider from Orlando Ribalta about halfway up the left field bleachers for his fifth homer in seven games.
Stanton’s 446th career homer was the highlight of his first game with at least five RBI since May 12, 2022 against the White Sox. It was his eighth game with at least five RBI and one shy of his career high.
Stanton also hit a bases-clearing double off the top of the left field fence with two outs in the third to give the Yankees a 3-1 lead off Washington starter MacKenzie Gore (5-13).
New York starter Luis Gil (2-1) allowed five hits and one run in five innings. He walked four for the third time since returning from a lat strain, and struck out five.
Anthony Volpe returned after sitting out two games and went 0 for 4 .
CJ Abrams hit an RBI single off Gil in the third.
Gore allowed three runs and three hits in five innings. The left-hander fell to 1-5 since the All-Star break as the Nationals lost their fourth straight.
How can I watch Washington Nationals vs. New York Yankees?
- TV Channel: Nationals at Yankees 2022 MLB Baseball, is broadcasted on MLB.TV.
- Online streaming: Sign up for Fubo.
Scoring Summary
 |
9th Inning | Wood grounded out to second. |
 |
9th Inning | Young struck out looking. |
 |
9th Inning | Hassell III struck out swinging. |
 |
9th Inning | Bednar relieved Doval |
 |
8th Inning | Goldschmidt grounded out to shortstop. |
 |
8th Inning | Wells struck out swinging. |
Statistics
 WSH WSH |
 NYY NYY |
|
|---|---|---|
| 1 | Games Played | 1 |
| 1 | Team Games Played | 1 |
| 1 | Hit By Pitch | 0 |
| 5 | Ground Balls | 11 |
| 12 | Strikeouts | 6 |
| 1 | Runs Batted In | 5 |
| 0 | Sacrifice Hit | 0 |
| 8 | Hits | 6 |
| 0 | Stolen Bases | 1 |
| 4 | Walks | 7 |
| 0 | Catcher Interference | 0 |
| 1 | Runs | 5 |
| 1 | Ground Into Double Play | 0 |
| 0 | Sacrifice Flies | 0 |
| 32 | At Bats | 30 |
| 0 | Home Runs | 1 |
| 0 | Grand Slam Home Runs | 0 |
| 23 | Runners Left On Base | 11 |
| 0 | Triples | 0 |
| 0 | Game Winning RBIs | 1 |
| 0 | Intentional Walks | 0 |
| 2 | Doubles | 3 |
| 15 | Fly Balls | 13 |
| 0 | Caught Stealing | 0 |
| 150 | Pitches | 177 |
| 0 | Games Started | 0 |
| 0 | Pinch At Bats | 1 |
| 0 | Pinch Hits | 0 |
| 0.0 | Player Rating | 0.0 |
| 1 | Is Qualified | 1 |
| 0 | Is Qualified In Steals | 1 |
| 10 | Total Bases | 12 |
| 37 | Plate Appearances | 37 |
| 0.0 | Projected Home Runs | 162.0 |
| 2 | Extra Base Hits | 4 |
| 3.6 | Runs Created | 5.0 |
| .250 | Batting Average | .200 |
| .000 | Pinch Hit Average | .000 |
| .313 | Slugging Percentage | .400 |
| .188 | Secondary Average | .467 |
| .351 | On Base Percentage | .351 |
| .664 | OBP Pct + SLG Pct | .751 |
| 0.3 | Ground To Fly Ball Ratio | 0.8 |
| 3.9 | Runs Created Per 27 Outs | 5.6 |
| 16.0 | Batter Rating | 36.0 |
| 0.0 | At Bats Per Home Run | 30.0 |
| 0.00 | Stolen Base Percentage | 1.00 |
| 4.05 | Pitches Per Plate Appearance | 4.78 |
| .063 | Isolated Power | .200 |
| 0.33 | Walk To Strikeout Ratio | 1.17 |
| .108 | Walks Per Plate Appearance | .189 |
| -.063 | Secondary Average Minus Batting Average | .267 |
| 2.0 | Runs Produced | 10.0 |
| 1.0 | Runs Ratio | 1.0 |
| 0.4 | Patience Ratio | 0.6 |
| 0.4 | Balls In Play Average | 0.2 |
| 71.3 | MLB Rating | 81.5 |
| 0.0 | Offensive Wins Above Replacement | 0.0 |
| 0.0 | Wins Above Replacement | 0.0 |
Game Information

Location: Bronx, New York
Attendance: 35,531 | Capacity: