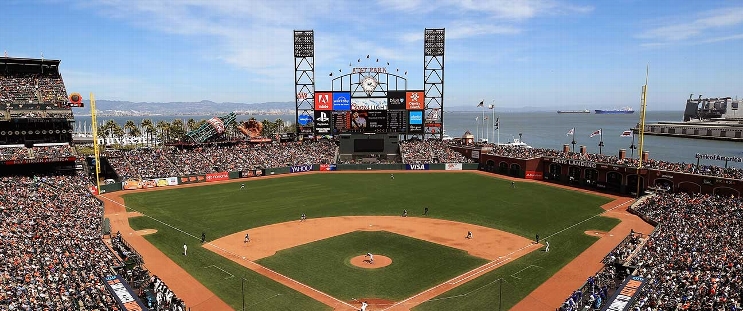
Chicago Cubs at San Francisco Giants
· Major League Baseball
2 - 5

Justin Verlander wins first home game since joining Giants as San Francisco beats Cubs 5-2

Verlander (2-10) allowed two runs on seven hits, struck out five and walked two over six innings. He had been 0-6 at home this season, and the Giants had gone 3-9 in his previous 12 outings at Oracle Park since he signed a $15 million, one-year contract in January.
Chapman connected for his 17th homer as San Francisco won its third straight following a four-game skid.
Rafael Devers blooped a go-ahead single into shallow left field with two out in the fifth after Heliot Ramos doubled to tie it. Carson Kelly had given Chicago the lead on a single in the top of the inning.
Flores homered in the second to stake Verlander to an early lead. Matt Shaw's RBI single in the fourth tied it.
Ryan Walker finished for his 12th save.
Matthew Boyd (12-7) struck out eight over 5 1/3 innings for the Cubs, who had won three straight and eight of 10. His last time out against Milwaukee, the lefty ended a four-start winless stretch in which he was 0-3.
How can I watch Chicago Cubs vs. San Francisco Giants?
- TV Channel: Cubs at Giants 2022 MLB Baseball, is broadcasted on MLB.TV.
- Online streaming: Sign up for Fubo.
Scoring Summary
 |
9th Inning | Caissie struck out swinging. |
 |
9th Inning | Caissie hit for Turner |
 |
9th Inning | Castro struck out swinging. |
 |
9th Inning | Castro hit for Shaw |
 |
9th Inning | Swanson singled to center. |
 |
9th Inning | Hoerner grounded out to second. |
Statistics
 CHC CHC |
 SF SF |
|
|---|---|---|
| 1 | Games Played | 1 |
| 1 | Team Games Played | 1 |
| 0 | Hit By Pitch | 0 |
| 0 | Ground Balls | 0 |
| 10 | Strikeouts | 10 |
| 2 | Runs Batted In | 5 |
| 0 | Sacrifice Hit | 0 |
| 8 | Hits | 7 |
| 1 | Stolen Bases | 1 |
| 2 | Walks | 3 |
| 0 | Catcher Interference | 0 |
| 2 | Runs | 5 |
| 0 | Ground Into Double Play | 1 |
| 0 | Sacrifice Flies | 0 |
| 35 | At Bats | 30 |
| 0 | Home Runs | 2 |
| 0 | Grand Slam Home Runs | 0 |
| 10 | Runners Left On Base | 10 |
| 0 | Triples | 0 |
| 0 | Game Winning RBIs | 0 |
| 0 | Intentional Walks | 0 |
| 2 | Doubles | 2 |
| 0 | Fly Balls | 0 |
| 0 | Caught Stealing | 0 |
| 145 | Pitches | 122 |
| 0 | Games Started | 0 |
| 0 | Pinch At Bats | 0 |
| 0 | Pinch Hits | 0 |
| 0.0 | Player Rating | 0.0 |
| 1 | Is Qualified | 1 |
| 1 | Is Qualified In Steals | 1 |
| 10 | Total Bases | 15 |
| 37 | Plate Appearances | 33 |
| 0.0 | Projected Home Runs | 324.0 |
| 2 | Extra Base Hits | 4 |
| 2.9 | Runs Created | 4.5 |
| .229 | Batting Average | .233 |
| .000 | Pinch Hit Average | .000 |
| .286 | Slugging Percentage | .500 |
| .143 | Secondary Average | .400 |
| .270 | On Base Percentage | .303 |
| .556 | OBP Pct + SLG Pct | .803 |
| 0.0 | Ground To Fly Ball Ratio | 0.0 |
| 2.9 | Runs Created Per 27 Outs | 5.0 |
| 21.0 | Batter Rating | 38.0 |
| 0.0 | At Bats Per Home Run | 15.0 |
| 1.00 | Stolen Base Percentage | 1.00 |
| 3.92 | Pitches Per Plate Appearance | 3.70 |
| .057 | Isolated Power | .267 |
| 0.20 | Walk To Strikeout Ratio | 0.30 |
| .054 | Walks Per Plate Appearance | .091 |
| -.086 | Secondary Average Minus Batting Average | .167 |
| 4.0 | Runs Produced | 10.0 |
| 1.0 | Runs Ratio | 1.0 |
| 0.3 | Patience Ratio | 0.6 |
| 0.3 | Balls In Play Average | 0.3 |
| 72.5 | MLB Rating | 83.8 |
| 0.0 | Offensive Wins Above Replacement | 0.0 |
| 0.0 | Wins Above Replacement | 0.0 |
Game Information

Location: San Francisco, California
Attendance: 35,060 | Capacity: