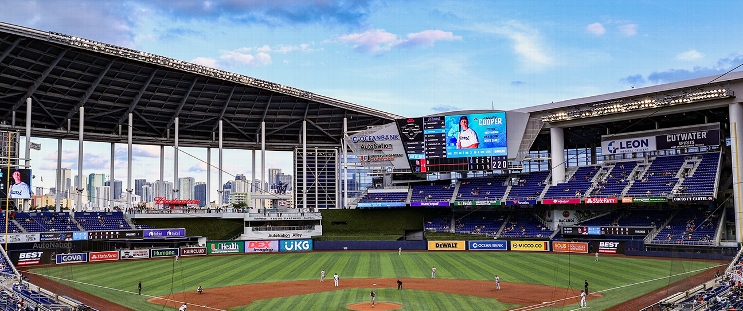
Atlanta Braves at Miami Marlins
· Major League Baseball
12 - 1

Ozzie Albies homers again as the Atlanta Braves beat the Miami Marlins 12-1

Jurickson Profar hit two solo homers for the Braves, who outscored the Marlins 21-1 over the last 10 innings of their three-game series. Matt Olson and Michael Harris II also went deep.
Atlanta star Ronald Acuña Jr. walked four times and was hit by a pitch, leading to the ejection of manager Brian Snitker.
Braves starter Joey Wentz (3-3) permitted one run and five hits in 6 2/3 innings.
After winning six consecutive series to get to 55-55 on Aug. 3, the Marlins (62-71) lost their seventh straight series.
Olson hit a two-run homer and Albies added a three-run drive against Ryan Gusto in the third. It was Albies’ third homer of the series after he hit two on Tuesday.
Profar put the Braves in front when he connected on Gusto's second pitch of the game.
Snitker was tossed after Gusto (7-7) plunked Acuña with the first pitch following Olson’s homer. An angry Acuña took a couple of steps toward the mound before heading to first.
Both benches emptied although no punches were thrown. Snitker protested crew chief Mark Wagner’s warnings of additional retaliations, leading to his ejection.
Harris made it 11-1 with a two-run blast in the sixth, and Profar homered again in the seventh.
Marlins: Open a four-game set at the New York Mets on Thursday night.
How can I watch Atlanta Braves vs. Miami Marlins?
- TV Channel: Braves at Marlins 2022 MLB Baseball, is broadcasted on MLB.TV.
- Online streaming: Sign up for Fubo.
Scoring Summary
 |
9th Inning | Myers grounded out to shortstop. |
 |
9th Inning | Wagaman flied out to right. |
 |
9th Inning | Johnston grounded out to second. |
 |
9th Inning | Baldwin flied out to left. |
 |
9th Inning | Acuña Jr. walked. |
 |
9th Inning | White flied out to left. |
Statistics
 ATL ATL |
 MIA MIA |
|
|---|---|---|
| 1 | Games Played | 1 |
| 1 | Team Games Played | 1 |
| 1 | Hit By Pitch | 0 |
| 6 | Ground Balls | 12 |
| 8 | Strikeouts | 6 |
| 12 | Runs Batted In | 1 |
| 0 | Sacrifice Hit | 0 |
| 11 | Hits | 5 |
| 0 | Stolen Bases | 1 |
| 10 | Walks | 2 |
| 0 | Catcher Interference | 0 |
| 12 | Runs | 1 |
| 0 | Ground Into Double Play | 1 |
| 0 | Sacrifice Flies | 0 |
| 38 | At Bats | 31 |
| 5 | Home Runs | 0 |
| 0 | Grand Slam Home Runs | 0 |
| 15 | Runners Left On Base | 7 |
| 0 | Triples | 0 |
| 1 | Game Winning RBIs | 0 |
| 0 | Intentional Walks | 0 |
| 2 | Doubles | 1 |
| 24 | Fly Balls | 13 |
| 0 | Caught Stealing | 0 |
| 209 | Pitches | 114 |
| 0 | Games Started | 0 |
| 0 | Pinch At Bats | 0 |
| 0 | Pinch Hits | 0 |
| 0.0 | Player Rating | 0.0 |
| 1 | Is Qualified | 1 |
| 0 | Is Qualified In Steals | 1 |
| 28 | Total Bases | 6 |
| 49 | Plate Appearances | 33 |
| 810.0 | Projected Home Runs | 0.0 |
| 7 | Extra Base Hits | 1 |
| 12.1 | Runs Created | 0.7 |
| .289 | Batting Average | .161 |
| .000 | Pinch Hit Average | .000 |
| .737 | Slugging Percentage | .194 |
| .711 | Secondary Average | .129 |
| .449 | On Base Percentage | .212 |
| 1.186 | OBP Pct + SLG Pct | .406 |
| 0.3 | Ground To Fly Ball Ratio | 0.9 |
| 12.1 | Runs Created Per 27 Outs | 0.7 |
| 78.0 | Batter Rating | 12.0 |
| 7.6 | At Bats Per Home Run | 0.0 |
| 0.00 | Stolen Base Percentage | 1.00 |
| 4.27 | Pitches Per Plate Appearance | 3.45 |
| .447 | Isolated Power | .032 |
| 1.25 | Walk To Strikeout Ratio | 0.33 |
| .204 | Walks Per Plate Appearance | .061 |
| .421 | Secondary Average Minus Batting Average | -.032 |
| 24.0 | Runs Produced | 2.0 |
| 1.0 | Runs Ratio | 1.0 |
| 0.9 | Patience Ratio | 0.2 |
| 0.2 | Balls In Play Average | 0.2 |
| 116.0 | MLB Rating | 64.8 |
| 0.0 | Offensive Wins Above Replacement | 0.0 |
| 0.0 | Wins Above Replacement | 0.0 |
Game Information

Location: Miami, Florida
Attendance: 12,453 | Capacity: