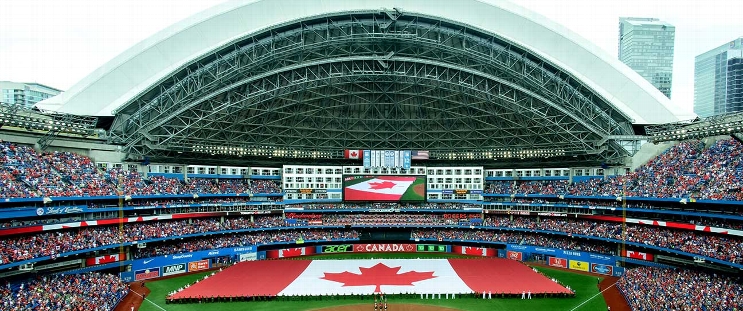
Minnesota Twins at Toronto Blue Jays
· Major League Baseball
8 - 9

Addison Barger hits go-ahead double in 8th as Blue Jays rally to beat Twins 9-8

Toronto trailed 8-6 heading to the bottom of the eighth against reliever Génesis Cabrera, but pinch-hitter Ty France cut the deficit to one with his second home run of the season.
Pinch-hitter Alejandro Kirk chased Cabrera with a single and Michael Tonkin (2-1) walked George Springer before Barger doubled off the wall in right.
Davis Schneider homered twice and Andrés Giménez also connected for the Blue Jays. Toronto is 58-4 when scoring five or more.
Schneider hit a two-out homer in the second and a leadoff drive in the fourth in his third career multihomer game. The homers were his ninth and 10th.
Seranthony Domínguez (3-4) got two outs for the win and Jeff Hoffman finished for his 29th save in 36 chances.
Minnesota's Byron Buxton hit two solo home runs, and Brooks Lee and Luke Keaschall also hit solo blasts.
Buxton opened the game with his 16th career leadoff homer, then went deep again in the third. The homers were his 26th and 27th. It was Buxton’s 16th career multihomer game.
Keaschall homered in the third, his fourth. Lee went deep in the fifth, his 14th.
Blue Jays: RHP Shane Bieber (1-0, 1.50 ERA) was expected to start against at home Milwaukee RHP Freddy Peralta (15-5, 2.68) on Friday night.
----
How can I watch Minnesota Twins vs. Toronto Blue Jays?
- TV Channel: Twins at Blue Jays 2022 MLB Baseball, is broadcasted on MLB.TV.
- Online streaming: Sign up for Fubo.
Scoring Summary
 |
9th Inning | Lee grounded out to first. |
 |
9th Inning | Keaschall doubled to left. |
 |
9th Inning | Wallner struck out swinging. |
 |
9th Inning | Jeffers lined out to right. |
 |
9th Inning | Hoffman relieved Domínguez |
 |
9th Inning | Kirk catching. |
Statistics
 MIN MIN |
 TOR TOR |
|
|---|---|---|
| 1 | Games Played | 1 |
| 1 | Team Games Played | 1 |
| 0 | Hit By Pitch | 0 |
| 10 | Ground Balls | 9 |
| 10 | Strikeouts | 9 |
| 7 | Runs Batted In | 9 |
| 0 | Sacrifice Hit | 0 |
| 12 | Hits | 12 |
| 5 | Stolen Bases | 1 |
| 2 | Walks | 4 |
| 0 | Catcher Interference | 0 |
| 8 | Runs | 9 |
| 0 | Ground Into Double Play | 0 |
| 0 | Sacrifice Flies | 0 |
| 39 | At Bats | 36 |
| 4 | Home Runs | 4 |
| 0 | Grand Slam Home Runs | 0 |
| 7 | Runners Left On Base | 16 |
| 0 | Triples | 0 |
| 0 | Game Winning RBIs | 1 |
| 0 | Intentional Walks | 0 |
| 2 | Doubles | 2 |
| 19 | Fly Balls | 18 |
| 0 | Caught Stealing | 0 |
| 164 | Pitches | 156 |
| 0 | Games Started | 0 |
| 0 | Pinch At Bats | 3 |
| 0 | Pinch Hits | 2 |
| 0.0 | Player Rating | 0.0 |
| 1 | Is Qualified | 1 |
| 1 | Is Qualified In Steals | 1 |
| 26 | Total Bases | 26 |
| 41 | Plate Appearances | 40 |
| 648.0 | Projected Home Runs | 648.0 |
| 6 | Extra Base Hits | 6 |
| 9.5 | Runs Created | 9.9 |
| .308 | Batting Average | .333 |
| .000 | Pinch Hit Average | .667 |
| .667 | Slugging Percentage | .722 |
| .538 | Secondary Average | .528 |
| .341 | On Base Percentage | .400 |
| 1.008 | OBP Pct + SLG Pct | 1.122 |
| 0.5 | Ground To Fly Ball Ratio | 0.5 |
| 9.5 | Runs Created Per 27 Outs | 11.1 |
| 63.0 | Batter Rating | 65.0 |
| 9.8 | At Bats Per Home Run | 9.0 |
| 1.00 | Stolen Base Percentage | 1.00 |
| 4.00 | Pitches Per Plate Appearance | 3.90 |
| .359 | Isolated Power | .389 |
| 0.20 | Walk To Strikeout Ratio | 0.44 |
| .049 | Walks Per Plate Appearance | .100 |
| .231 | Secondary Average Minus Batting Average | .194 |
| 15.0 | Runs Produced | 18.0 |
| 0.9 | Runs Ratio | 1.0 |
| 0.7 | Patience Ratio | 0.8 |
| 0.3 | Balls In Play Average | 0.3 |
| 104.5 | MLB Rating | 108.0 |
| 0.0 | Offensive Wins Above Replacement | 0.0 |
| 0.0 | Wins Above Replacement | 0.0 |
Game Information

Location: Toronto, Ontario
Attendance: 42,361 | Capacity: