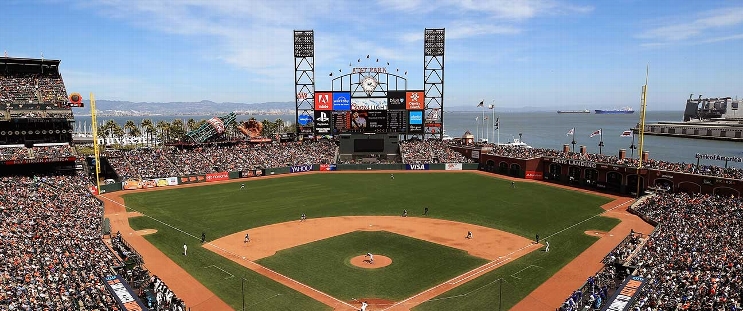
Chicago Cubs at San Francisco Giants
· Major League Baseball
3 - 12

Rafael Devers hits two of San Francisco's four home runs, Giants power past Cubs 12-3

Devers hit a solo homer in the first and added a three-run drive in the sixth for his 21st career multihomer game, third this year and second since joining the Giants in a trade from Boston in mid-June.
Chapman added an RBI single into shallow right in the fifth that right fielder Kyle Tucker then threw wildly over home plate allowing a second run to score. Casey Schmitt followed with an RBI single.
Heliot Ramos also homered, while Willy Adames and Dominic Smith each added sacrifice flies in the third inning.
Giants rookie starter Carson Whisenhunt (2-1) allowed three runs on five hits, struck out three and walked three in his fifth career start and second outing since being recalled from Triple-A Sacramento last Friday.
Nico Hoerner hit a three-run homer in the second inning for the Cubs. They have lost both series this season to San Francisco after the Giants won two of three from at Wrigley Field in May.
Chicago right-hander Colin Rea (10-6) had allowed two or fewer runs in four straight outings beginning Aug. 3. Rea took his first loss in August after winning his initial two decisions.
How can I watch Chicago Cubs vs. San Francisco Giants?
- TV Channel: Cubs at Giants 2022 MLB Baseball, is broadcasted on MLB.TV.
- Online streaming: Sign up for Fubo.
Scoring Summary
 |
9th Inning | Shaw grounded out to third. |
 |
9th Inning | Busch walked. |
 |
9th Inning | Crow-Armstrong flied out to center. |
 |
9th Inning | Kelly fouled out to first. |
 |
9th Inning | Seymour relieved Beck |
 |
9th Inning | Schmitt at third base. |
Statistics
 CHC CHC |
 SF SF |
|
|---|---|---|
| 1 | Games Played | 1 |
| 1 | Team Games Played | 1 |
| 1 | Hit By Pitch | 1 |
| 0 | Ground Balls | 0 |
| 8 | Strikeouts | 4 |
| 3 | Runs Batted In | 11 |
| 0 | Sacrifice Hit | 0 |
| 5 | Hits | 13 |
| 0 | Stolen Bases | 0 |
| 4 | Walks | 3 |
| 0 | Catcher Interference | 0 |
| 3 | Runs | 12 |
| 2 | Ground Into Double Play | 0 |
| 0 | Sacrifice Flies | 2 |
| 30 | At Bats | 35 |
| 1 | Home Runs | 4 |
| 0 | Grand Slam Home Runs | 0 |
| 12 | Runners Left On Base | 11 |
| 0 | Triples | 0 |
| 0 | Game Winning RBIs | 0 |
| 0 | Intentional Walks | 0 |
| 0 | Doubles | 2 |
| 0 | Fly Balls | 0 |
| 0 | Caught Stealing | 0 |
| 138 | Pitches | 137 |
| 0 | Games Started | 0 |
| 0 | Pinch At Bats | 0 |
| 0 | Pinch Hits | 0 |
| 0.0 | Player Rating | 0.0 |
| 1 | Is Qualified | 1 |
| 0 | Is Qualified In Steals | 0 |
| 8 | Total Bases | 27 |
| 35 | Plate Appearances | 41 |
| 162.0 | Projected Home Runs | 648.0 |
| 1 | Extra Base Hits | 6 |
| 1.8 | Runs Created | 10.6 |
| .167 | Batting Average | .371 |
| .000 | Pinch Hit Average | .000 |
| .267 | Slugging Percentage | .771 |
| .233 | Secondary Average | .486 |
| .286 | On Base Percentage | .415 |
| .552 | OBP Pct + SLG Pct | 1.186 |
| 0.0 | Ground To Fly Ball Ratio | 0.0 |
| 1.8 | Runs Created Per 27 Outs | 12.0 |
| 20.0 | Batter Rating | 75.0 |
| 30.0 | At Bats Per Home Run | 8.8 |
| 0.00 | Stolen Base Percentage | 0.00 |
| 3.94 | Pitches Per Plate Appearance | 3.34 |
| .100 | Isolated Power | .400 |
| 0.50 | Walk To Strikeout Ratio | 0.75 |
| .114 | Walks Per Plate Appearance | .073 |
| .067 | Secondary Average Minus Batting Average | .114 |
| 6.0 | Runs Produced | 23.0 |
| 1.0 | Runs Ratio | 0.9 |
| 0.4 | Patience Ratio | 0.8 |
| 0.2 | Balls In Play Average | 0.3 |
| 71.0 | MLB Rating | 117.0 |
| 0.0 | Offensive Wins Above Replacement | 0.0 |
| 0.0 | Wins Above Replacement | 0.0 |
Game Information

Location: San Francisco, California
Attendance: 30,457 | Capacity: