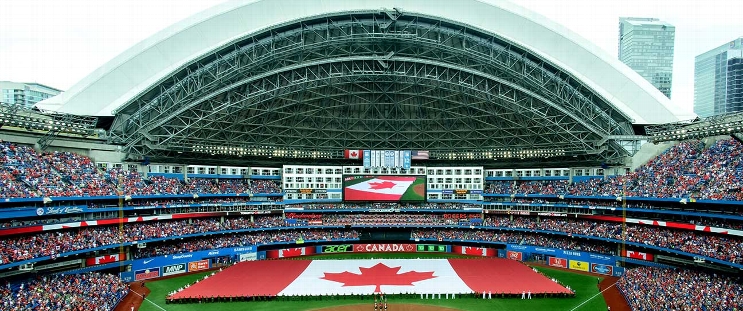
Milwaukee Brewers at Toronto Blue Jays
· Major League Baseball
7 - 2

Freddy Peralta pitches 6 shutout innings for MLB-leading 16th win as Brewers beat Blue Jays 7-2

Peralta (16-5) allowed one hit, a two-out double by Alejandro Kirk in the second inning. He struck out eight and walked one. The right-hander went 4-0 with a 0.32 ERA in five August starts.
Andrew Vaughn had three hits and drove in two runs for the Brewers, who are 20-8 in August with two games remaining this month.
Making his second start for the Blue Jays, Shane Bieber (1-1) allowed two runs and five hits in 5 1/3 innings. He walked none and struck out six.
Monasterio homered off Bieber to begin the sixth, his fourth. Brice Turang singled and William Contreras flew out before Brendon Little came on to face Christian Yelich, who walked. Vaughn followed with an RBI single and Little exited after striking out Sal Frelick.
Caleb Durbin greeted Louis Varland with an RBI single and Isaac Collins capped the five-run inning with a two-RBI double.
Blue Jays outfielder Daulton Varsho exited in the seventh after he was hit on the right pinkie by a 97-mph pitch from Aaron Ashby. Myles Straw ran for Varsho. Manager John Schneider said after the game that X-rays on Varsho's finger did not reveal a fracture.
Davis Schneider hit a two-run single off Ashby, but Andrés Giménez followed by grounding into an inning-ending double play.
How can I watch Milwaukee Brewers vs. Toronto Blue Jays?
- TV Channel: Brewers at Blue Jays 2022 MLB Baseball, is broadcasted on MLBN.
- Online streaming: Sign up for Fubo.
Scoring Summary
 |
9th Inning | Lukes grounded out to shortstop. |
 |
9th Inning | Kirk flied out to right. |
 |
9th Inning | Straw popped out to second. |
 |
9th Inning | Bichette singled to right. |
 |
9th Inning | Uribe relieved Miller |
 |
9th Inning | Frelick lined out to left. |
Statistics
 MIL MIL |
 TOR TOR |
|
|---|---|---|
| 1 | Games Played | 1 |
| 1 | Team Games Played | 1 |
| 0 | Hit By Pitch | 2 |
| 11 | Ground Balls | 9 |
| 12 | Strikeouts | 9 |
| 7 | Runs Batted In | 2 |
| 0 | Sacrifice Hit | 0 |
| 11 | Hits | 4 |
| 1 | Stolen Bases | 0 |
| 4 | Walks | 3 |
| 0 | Catcher Interference | 0 |
| 7 | Runs | 2 |
| 1 | Ground Into Double Play | 2 |
| 0 | Sacrifice Flies | 0 |
| 37 | At Bats | 29 |
| 1 | Home Runs | 0 |
| 0 | Grand Slam Home Runs | 0 |
| 16 | Runners Left On Base | 13 |
| 0 | Triples | 0 |
| 1 | Game Winning RBIs | 0 |
| 0 | Intentional Walks | 0 |
| 2 | Doubles | 1 |
| 14 | Fly Balls | 11 |
| 0 | Caught Stealing | 0 |
| 185 | Pitches | 143 |
| 0 | Games Started | 0 |
| 0 | Pinch At Bats | 0 |
| 0 | Pinch Hits | 0 |
| 0.0 | Player Rating | 0.0 |
| 1 | Is Qualified | 1 |
| 1 | Is Qualified In Steals | 0 |
| 16 | Total Bases | 5 |
| 41 | Plate Appearances | 34 |
| 162.0 | Projected Home Runs | 0.0 |
| 3 | Extra Base Hits | 1 |
| 5.8 | Runs Created | 0.7 |
| .297 | Batting Average | .138 |
| .000 | Pinch Hit Average | .000 |
| .432 | Slugging Percentage | .172 |
| .270 | Secondary Average | .138 |
| .366 | On Base Percentage | .265 |
| .798 | OBP Pct + SLG Pct | .437 |
| 0.8 | Ground To Fly Ball Ratio | 0.8 |
| 5.8 | Runs Created Per 27 Outs | 0.7 |
| 47.0 | Batter Rating | 14.0 |
| 37.0 | At Bats Per Home Run | 0.0 |
| 1.00 | Stolen Base Percentage | 0.00 |
| 4.51 | Pitches Per Plate Appearance | 4.21 |
| .135 | Isolated Power | .034 |
| 0.33 | Walk To Strikeout Ratio | 0.33 |
| .098 | Walks Per Plate Appearance | .088 |
| -.027 | Secondary Average Minus Batting Average | .000 |
| 14.0 | Runs Produced | 4.0 |
| 1.0 | Runs Ratio | 1.0 |
| 0.5 | Patience Ratio | 0.3 |
| 0.4 | Balls In Play Average | 0.2 |
| 91.8 | MLB Rating | 64.8 |
| 0.0 | Offensive Wins Above Replacement | 0.0 |
| 0.0 | Wins Above Replacement | 0.0 |
Game Information

Location: Toronto, Ontario
Attendance: 41,390 | Capacity:
2025 National League Central Standings
| TEAM | W | L | PCT | GB | STRK |
|---|---|---|---|---|---|
 Milwaukee Milwaukee |
86 | 55 | .610 | - | L1 |
 Chicago Chicago |
80 | 60 | .571 | 5.5 | L1 |
 Cincinnati Cincinnati |
70 | 70 | .500 | 15.5 | L2 |
 St. Louis St. Louis |
70 | 71 | .496 | 16 | W2 |
 Pittsburgh Pittsburgh |
63 | 77 | .450 | 22.5 | W2 |
2025 American League East Standings
| TEAM | W | L | PCT | GB | STRK |
|---|---|---|---|---|---|
 Toronto Toronto |
81 | 59 | .579 | - | W2 |
 New York New York |
77 | 62 | .554 | 3.5 | L1 |
 Boston Boston |
78 | 63 | .553 | 3.5 | L1 |
 Tampa Bay Tampa Bay |
70 | 69 | .504 | 10.5 | W6 |
 Baltimore Baltimore |
64 | 76 | .457 | 17 | W3 |