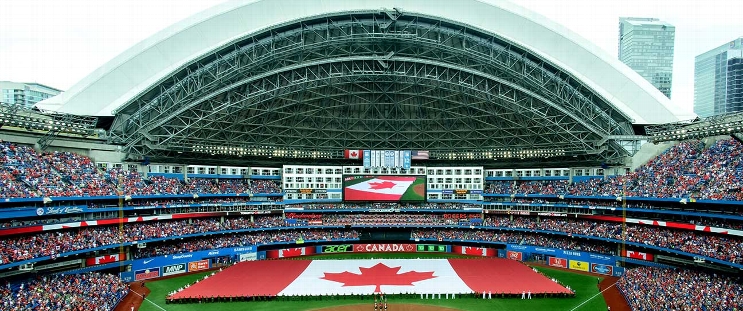
Milwaukee Brewers at Toronto Blue Jays
· Major League Baseball
4 - 1

Chourio and Yelich hit back-to-back HRs off Hoffman in the ninth as the Brewers beat the Blue Jays

Milwaukee (85-52) owns the best record in the majors.
Back in the lineup after missing 28 games because of a strained right hamstring, Chourio broke a 1-1 tie with a drive to right off Toronto closer Jeff Hoffman. The homer was Chourio’s 18th.
Yelich hit a drive to left on Hoffman’s next pitch for his 27th homer.
Hoffman (8-6) has allowed 14 home runs this season, tied for the most by any big league reliever.
Aaron Ashby (3-1) got one out for the win, and Abner Uribe finished for his fourth save in six chances.
Toronto’s Vladimir Guerrero Jr. drove in the first run of the game with a sacrifice fly in the sixth inning.
The Brewers tied it in the seventh. Yelich led off with a double, ending a streak of nine consecutive outs by Toronto’s Kevin Gausman. Yelich advanced on a grounder and scored on Sal Frelick’s high chopper between the mound and first base.
Milwaukee’s Quinn Priester gave up five hits and one unearned run in six innings. Priester has not lost since May 13 at Cleveland.
Gausman allowed four hits in seven innings. He struck out eight and walked none.
How can I watch Milwaukee Brewers vs. Toronto Blue Jays?
- TV Channel: Brewers at Blue Jays 2022 MLB Baseball, is broadcasted on MLB.TV.
- Online streaming: Sign up for Fubo.
Scoring Summary
 |
9th Inning | Kirk grounded into double play, shortstop to second to first, Bichette out at second. |
 |
9th Inning | Bichette singled to center. |
 |
9th Inning | Guerrero Jr. struck out swinging. |
 |
9th Inning | Uribe relieved Ashby |
 |
9th Inning | Durbin struck out swinging. |
 |
9th Inning | Rodríguez relieved Hoffman |
Statistics
 MIL MIL |
 TOR TOR |
|
|---|---|---|
| 1 | Games Played | 1 |
| 1 | Team Games Played | 1 |
| 0 | Hit By Pitch | 0 |
| 12 | Ground Balls | 14 |
| 9 | Strikeouts | 8 |
| 4 | Runs Batted In | 1 |
| 0 | Sacrifice Hit | 0 |
| 9 | Hits | 7 |
| 0 | Stolen Bases | 0 |
| 1 | Walks | 0 |
| 0 | Catcher Interference | 0 |
| 4 | Runs | 1 |
| 1 | Ground Into Double Play | 2 |
| 0 | Sacrifice Flies | 1 |
| 34 | At Bats | 31 |
| 2 | Home Runs | 0 |
| 0 | Grand Slam Home Runs | 0 |
| 12 | Runners Left On Base | 11 |
| 0 | Triples | 0 |
| 1 | Game Winning RBIs | 0 |
| 0 | Intentional Walks | 0 |
| 2 | Doubles | 1 |
| 13 | Fly Balls | 10 |
| 0 | Caught Stealing | 0 |
| 134 | Pitches | 123 |
| 0 | Games Started | 0 |
| 0 | Pinch At Bats | 2 |
| 0 | Pinch Hits | 0 |
| 0.0 | Player Rating | 0.0 |
| 1 | Is Qualified | 1 |
| 0 | Is Qualified In Steals | 0 |
| 17 | Total Bases | 8 |
| 35 | Plate Appearances | 32 |
| 324.0 | Projected Home Runs | 0.0 |
| 4 | Extra Base Hits | 1 |
| 4.5 | Runs Created | 0.8 |
| .265 | Batting Average | .226 |
| .000 | Pinch Hit Average | .000 |
| .500 | Slugging Percentage | .258 |
| .265 | Secondary Average | .032 |
| .286 | On Base Percentage | .219 |
| .786 | OBP Pct + SLG Pct | .477 |
| 0.9 | Ground To Fly Ball Ratio | 1.4 |
| 4.7 | Runs Created Per 27 Outs | 0.8 |
| 35.0 | Batter Rating | 13.0 |
| 17.0 | At Bats Per Home Run | 0.0 |
| 0.00 | Stolen Base Percentage | 0.00 |
| 3.83 | Pitches Per Plate Appearance | 3.84 |
| .235 | Isolated Power | .032 |
| 0.11 | Walk To Strikeout Ratio | 0.00 |
| .029 | Walks Per Plate Appearance | .000 |
| .000 | Secondary Average Minus Batting Average | -.194 |
| 8.0 | Runs Produced | 2.0 |
| 1.0 | Runs Ratio | 1.0 |
| 0.5 | Patience Ratio | 0.3 |
| 0.3 | Balls In Play Average | 0.3 |
| 84.8 | MLB Rating | 68.3 |
| 0.0 | Offensive Wins Above Replacement | 0.0 |
| 0.0 | Wins Above Replacement | 0.0 |
Game Information

Location: Toronto, Ontario
Attendance: 41,424 | Capacity:
2025 National League Central Standings
| TEAM | W | L | PCT | GB | STRK |
|---|---|---|---|---|---|
 Milwaukee Milwaukee |
86 | 55 | .610 | - | L1 |
 Chicago Chicago |
80 | 60 | .571 | 5.5 | L1 |
 Cincinnati Cincinnati |
70 | 70 | .500 | 15.5 | L2 |
 St. Louis St. Louis |
70 | 71 | .496 | 16 | W2 |
 Pittsburgh Pittsburgh |
63 | 77 | .450 | 22.5 | W2 |
2025 American League East Standings
| TEAM | W | L | PCT | GB | STRK |
|---|---|---|---|---|---|
 Toronto Toronto |
81 | 59 | .579 | - | W2 |
 New York New York |
77 | 62 | .554 | 3.5 | L1 |
 Boston Boston |
78 | 63 | .553 | 3.5 | L1 |
 Tampa Bay Tampa Bay |
70 | 69 | .504 | 10.5 | W6 |
 Baltimore Baltimore |
64 | 76 | .457 | 17 | W3 |