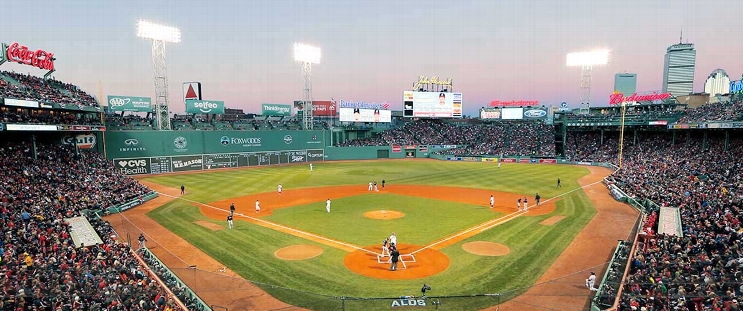
Pittsburgh Pirates at Boston Red Sox
· Major League Baseball
10 - 3

Oneil Cruz homers as the surging Pirates beat the Red Sox 10-3

Tommy Pham and Nick Gonzales also drove in two runs apiece as Pittsburgh won for the eighth time in 10 games. Johan Oviedo (2-0) pitched five innings of two-run ball.
Pittsburgh also beat Boston 4-2 on Friday night. The Pirates (61-76) are in last place in the NL Central, and the Red Sox (75-62) hold the second wild-card position in the AL.
Carlos Narváez hit his 12th homer for Boston, and Romy Gonzalez had two hits and two RBI.
Red Sox right-hander Dustin May (7-11) permitted seven runs, six earned, and eight hits in 5 1/3 innings. It was his worst start since he was acquired in a July 31 trade with the Dodgers.
Cruz led off the sixth with a 426-foot drive into the Green Monster seats for his 19th homer, sparking a five-run inning. Gonzales hit a two-run single with two down, giving the Pirates a 9-2 lead.
How can I watch Pittsburgh Pirates vs. Boston Red Sox?
- TV Channel: Pirates at Red Sox 2022 MLB Baseball, is broadcasted on MLBN.
- Online streaming: Sign up for Fubo.
Scoring Summary
 |
9th Inning | Bregman popped out to first. |
 |
9th Inning | Anthony grounded out to shortstop. |
 |
9th Inning | Narváez grounded out to second. |
 |
9th Inning | Sisk relieved Ramírez |
 |
9th Inning | Kiner-Falefa grounded into double play, second to first, Bart out at second. |
 |
9th Inning | Bart walked. |
Statistics
 PIT PIT |
 BOS BOS |
|
|---|---|---|
| 1 | Games Played | 1 |
| 1 | Team Games Played | 1 |
| 1 | Hit By Pitch | 1 |
| 14 | Ground Balls | 10 |
| 9 | Strikeouts | 8 |
| 8 | Runs Batted In | 3 |
| 0 | Sacrifice Hit | 0 |
| 12 | Hits | 8 |
| 0 | Stolen Bases | 1 |
| 7 | Walks | 3 |
| 0 | Catcher Interference | 0 |
| 10 | Runs | 3 |
| 2 | Ground Into Double Play | 0 |
| 0 | Sacrifice Flies | 0 |
| 37 | At Bats | 34 |
| 1 | Home Runs | 1 |
| 0 | Grand Slam Home Runs | 0 |
| 23 | Runners Left On Base | 21 |
| 0 | Triples | 0 |
| 1 | Game Winning RBIs | 0 |
| 0 | Intentional Walks | 0 |
| 2 | Doubles | 1 |
| 14 | Fly Balls | 16 |
| 1 | Caught Stealing | 1 |
| 154 | Pitches | 144 |
| 0 | Games Started | 0 |
| 0 | Pinch At Bats | 0 |
| 0 | Pinch Hits | 0 |
| 0.0 | Player Rating | 0.0 |
| 1 | Is Qualified | 1 |
| 1 | Is Qualified In Steals | 1 |
| 17 | Total Bases | 12 |
| 45 | Plate Appearances | 38 |
| 162.0 | Projected Home Runs | 162.0 |
| 3 | Extra Base Hits | 2 |
| 7.0 | Runs Created | 3.9 |
| .324 | Batting Average | .235 |
| .000 | Pinch Hit Average | .000 |
| .459 | Slugging Percentage | .353 |
| .297 | Secondary Average | .206 |
| .444 | On Base Percentage | .316 |
| .904 | OBP Pct + SLG Pct | .669 |
| 1.0 | Ground To Fly Ball Ratio | 0.6 |
| 6.7 | Runs Created Per 27 Outs | 3.9 |
| 55.0 | Batter Rating | 26.0 |
| 37.0 | At Bats Per Home Run | 34.0 |
| 0.00 | Stolen Base Percentage | 0.50 |
| 3.42 | Pitches Per Plate Appearance | 3.79 |
| .135 | Isolated Power | .118 |
| 0.78 | Walk To Strikeout Ratio | 0.38 |
| .156 | Walks Per Plate Appearance | .079 |
| -.027 | Secondary Average Minus Batting Average | -.029 |
| 18.0 | Runs Produced | 6.0 |
| 0.8 | Runs Ratio | 1.0 |
| 0.6 | Patience Ratio | 0.4 |
| 0.4 | Balls In Play Average | 0.3 |
| 99.3 | MLB Rating | 77.5 |
| 0.0 | Offensive Wins Above Replacement | 0.0 |
| 0.0 | Wins Above Replacement | 0.0 |
Game Information

Location: Boston, Massachusetts
Attendance: 36,391 | Capacity:
2025 National League Central Standings
| TEAM | W | L | PCT | GB | STRK |
|---|---|---|---|---|---|
 Milwaukee Milwaukee |
86 | 55 | .610 | - | L1 |
 Chicago Chicago |
80 | 60 | .571 | 5.5 | L1 |
 Cincinnati Cincinnati |
70 | 70 | .500 | 15.5 | L2 |
 St. Louis St. Louis |
70 | 71 | .496 | 16 | W2 |
 Pittsburgh Pittsburgh |
63 | 77 | .450 | 22.5 | W2 |
2025 American League East Standings
| TEAM | W | L | PCT | GB | STRK |
|---|---|---|---|---|---|
 Toronto Toronto |
81 | 59 | .579 | - | W2 |
 New York New York |
77 | 62 | .554 | 3.5 | L1 |
 Boston Boston |
78 | 63 | .553 | 3.5 | L1 |
 Tampa Bay Tampa Bay |
70 | 69 | .504 | 10.5 | W6 |
 Baltimore Baltimore |
64 | 76 | .457 | 17 | W3 |