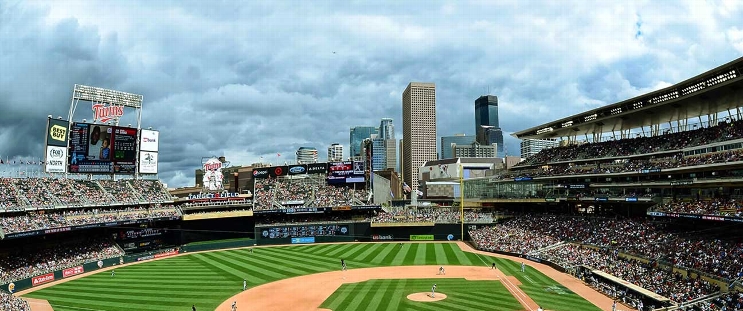
San Diego Padres at Minnesota Twins
· Major League Baseball
12 - 3

Díaz homers twice as Padres beat Twins 12-3

Ramón Laureano also homered for San Diego, which scored 11 runs against Minnesota relievers.
Manny Machado had two hits to top 1,000 with the Padres. He had an RBI single in the Padres' seven-run seventh inning that gave the Padres a 10-3 lead.
Byron Buxton homered and James Outman and Trevor Larnach each had two hits for the Twins.
Reliever Adrian Morejon (11-4) pitched a scoreless sixth inning to pick up the win for the Padres, who began the day two games behind the first-place Dodgers in the AL West and two games behind the Cubs for the top NL wild-card spot.
Twins starter Taj Bradley allowed just one run and one hit over five innings, and Buxton's two-run homer off Nick Pivetta gave Minnesota a 3-1 lead after five.
But reliever Mick Abel (2-4) — one of the Twins' key acquisitions in their flurry of deadline-day trades — quickly gave that lead back as the Padres used three hits, a walk and an error to score twice in the sixth to tie the score.
Abel then allowed four consecutive singles to start the seventh before he was pulled. The Padres went on to score seven runs in the inning, capped by Díaz's second home run of the night.
Laureano hit a two-run homer in the eighth.
How can I watch San Diego Padres vs. Minnesota Twins?
- TV Channel: Padres at Twins 2022 MLB Baseball, is broadcasted on MLB.TV.
- Online streaming: Sign up for Fubo.
Scoring Summary
 |
9th Inning | Lewis popped out to first. |
 |
9th Inning | Clemens flied out to center. |
 |
9th Inning | Gasper fouled out to first. |
 |
9th Inning | Jacob relieved Estrada |
 |
9th Inning | O'Hearn flied out to center. |
 |
9th Inning | McCoy flied out to center. |
Statistics
 SD SD |
 MIN MIN |
|
|---|---|---|
| 1 | Games Played | 1 |
| 1 | Team Games Played | 1 |
| 0 | Hit By Pitch | 0 |
| 12 | Ground Balls | 13 |
| 9 | Strikeouts | 7 |
| 12 | Runs Batted In | 3 |
| 1 | Sacrifice Hit | 0 |
| 14 | Hits | 5 |
| 0 | Stolen Bases | 2 |
| 7 | Walks | 1 |
| 0 | Catcher Interference | 0 |
| 12 | Runs | 3 |
| 0 | Ground Into Double Play | 0 |
| 0 | Sacrifice Flies | 0 |
| 41 | At Bats | 33 |
| 3 | Home Runs | 1 |
| 0 | Grand Slam Home Runs | 0 |
| 23 | Runners Left On Base | 9 |
| 0 | Triples | 0 |
| 1 | Game Winning RBIs | 0 |
| 0 | Intentional Walks | 0 |
| 1 | Doubles | 0 |
| 21 | Fly Balls | 13 |
| 0 | Caught Stealing | 0 |
| 226 | Pitches | 136 |
| 0 | Games Started | 0 |
| 1 | Pinch At Bats | 2 |
| 0 | Pinch Hits | 0 |
| 0.0 | Player Rating | 0.0 |
| 1 | Is Qualified | 1 |
| 0 | Is Qualified In Steals | 1 |
| 24 | Total Bases | 8 |
| 49 | Plate Appearances | 34 |
| 486.0 | Projected Home Runs | 162.0 |
| 4 | Extra Base Hits | 1 |
| 10.3 | Runs Created | 1.3 |
| .341 | Batting Average | .152 |
| .000 | Pinch Hit Average | .000 |
| .585 | Slugging Percentage | .242 |
| .415 | Secondary Average | .182 |
| .438 | On Base Percentage | .176 |
| 1.023 | OBP Pct + SLG Pct | .419 |
| 0.6 | Ground To Fly Ball Ratio | 1.0 |
| 9.9 | Runs Created Per 27 Outs | 1.2 |
| 73.0 | Batter Rating | 22.0 |
| 13.7 | At Bats Per Home Run | 33.0 |
| 0.00 | Stolen Base Percentage | 1.00 |
| 4.61 | Pitches Per Plate Appearance | 4.00 |
| .244 | Isolated Power | .091 |
| 0.78 | Walk To Strikeout Ratio | 0.14 |
| .143 | Walks Per Plate Appearance | .029 |
| .073 | Secondary Average Minus Batting Average | .030 |
| 24.0 | Runs Produced | 6.0 |
| 1.0 | Runs Ratio | 1.0 |
| 0.7 | Patience Ratio | 0.3 |
| 0.4 | Balls In Play Average | 0.2 |
| 114.0 | MLB Rating | 70.0 |
| 0.0 | Offensive Wins Above Replacement | 0.0 |
| 0.0 | Wins Above Replacement | 0.0 |
Game Information

Location: Minneapolis, Minnesota
Attendance: 23,971 | Capacity:
2025 National League West Standings
| TEAM | W | L | PCT | GB | STRK |
|---|---|---|---|---|---|
 Los Angeles Los Angeles |
78 | 60 | .565 | - | L1 |
 San Diego San Diego |
76 | 63 | .547 | 2.5 | L3 |
 San Francisco San Francisco |
70 | 69 | .504 | 8.5 | W3 |
 Arizona Arizona |
69 | 71 | .493 | 10 | W1 |
 Colorado Colorado |
39 | 100 | .281 | 39.5 | L2 |
2025 American League Central Standings
| TEAM | W | L | PCT | GB | STRK |
|---|---|---|---|---|---|
 Detroit Detroit |
80 | 60 | .571 | - | L2 |
 Kansas City Kansas City |
70 | 68 | .507 | 9 | L2 |
 Cleveland Cleveland |
68 | 69 | .496 | 10.5 | L3 |
 Minnesota Minnesota |
62 | 76 | .449 | 17 | L2 |
 Chicago Chicago |
51 | 88 | .367 | 28.5 | W3 |