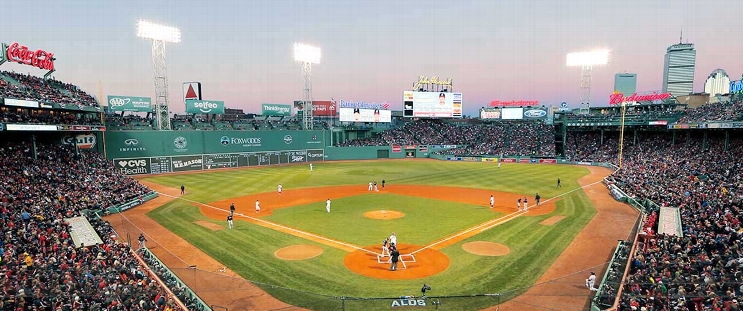
Cleveland Guardians at Boston Red Sox
· Major League Baseball
4 - 6

Carlos Narváez gets 1st career pinch hit, Trevor Story hits strange homer as Red Sox beat Guardians

Romy Gonzalez added an RBI single for the Red Sox, who won for the ninth time in 12 games to improve to an AL-best 35-18 since the beginning of July. The victory pulled the Red Sox (77-62) within a percentage point of the Yankees (76-61) for the AL’s top wild-card spot.
Kyle Manzardo hit a solo homer for the Guardians, who have dropped 13 of 20.
Narváez, a right-handed hitter, singled inside the first-base bag off lefty reliever Erik Sabrowski (0-1) with the bases loaded, making it 5-3.
Brayan Bello (11-6) worked through five innings, giving up three runs on six hits with four strikeouts and three walks.
Aroldis Chapman, who finalized a $13.3 million contract extension Sunday, got the final three outs for his 28th save.
Story made it 6-3 in the sixth before Manzardo homered to right.
How can I watch Cleveland Guardians vs. Boston Red Sox?
- TV Channel: Guardians at Red Sox 2022 MLB Baseball, is broadcasted on MLB.TV.
- Online streaming: Sign up for Fubo.
Scoring Summary
 |
9th Inning | Kwan lined out to left. |
 |
9th Inning | Rocchio struck out swinging. |
 |
9th Inning | Noel flied out to center. |
 |
9th Inning | Chapman relieved Weissert |
 |
9th Inning | Duran in left field. |
 |
8th Inning | Duran grounded out to first. |
Statistics
 CLE CLE |
 BOS BOS |
|
|---|---|---|
| 1 | Games Played | 1 |
| 1 | Team Games Played | 1 |
| 0 | Hit By Pitch | 1 |
| 13 | Ground Balls | 14 |
| 6 | Strikeouts | 6 |
| 4 | Runs Batted In | 5 |
| 0 | Sacrifice Hit | 0 |
| 8 | Hits | 14 |
| 1 | Stolen Bases | 1 |
| 3 | Walks | 5 |
| 0 | Catcher Interference | 0 |
| 4 | Runs | 6 |
| 1 | Ground Into Double Play | 2 |
| 0 | Sacrifice Flies | 0 |
| 34 | At Bats | 36 |
| 1 | Home Runs | 1 |
| 0 | Grand Slam Home Runs | 0 |
| 15 | Runners Left On Base | 26 |
| 0 | Triples | 0 |
| 0 | Game Winning RBIs | 1 |
| 0 | Intentional Walks | 0 |
| 2 | Doubles | 2 |
| 15 | Fly Balls | 16 |
| 0 | Caught Stealing | 0 |
| 136 | Pitches | 166 |
| 0 | Games Started | 0 |
| 2 | Pinch At Bats | 2 |
| 0 | Pinch Hits | 1 |
| 0.0 | Player Rating | 0.0 |
| 1 | Is Qualified | 1 |
| 1 | Is Qualified In Steals | 1 |
| 13 | Total Bases | 19 |
| 37 | Plate Appearances | 42 |
| 162.0 | Projected Home Runs | 162.0 |
| 3 | Extra Base Hits | 3 |
| 3.9 | Runs Created | 8.4 |
| .235 | Batting Average | .389 |
| .000 | Pinch Hit Average | .500 |
| .382 | Slugging Percentage | .528 |
| .265 | Secondary Average | .306 |
| .297 | On Base Percentage | .476 |
| .680 | OBP Pct + SLG Pct | 1.004 |
| 0.9 | Ground To Fly Ball Ratio | 0.9 |
| 3.9 | Runs Created Per 27 Outs | 9.5 |
| 32.0 | Batter Rating | 44.0 |
| 34.0 | At Bats Per Home Run | 36.0 |
| 1.00 | Stolen Base Percentage | 1.00 |
| 3.68 | Pitches Per Plate Appearance | 3.95 |
| .147 | Isolated Power | .139 |
| 0.50 | Walk To Strikeout Ratio | 0.83 |
| .081 | Walks Per Plate Appearance | .119 |
| .029 | Secondary Average Minus Batting Average | -.083 |
| 8.0 | Runs Produced | 11.0 |
| 1.0 | Runs Ratio | 0.8 |
| 0.4 | Patience Ratio | 0.6 |
| 0.3 | Balls In Play Average | 0.4 |
| 81.0 | MLB Rating | 97.8 |
| 0.0 | Offensive Wins Above Replacement | 0.0 |
| 0.0 | Wins Above Replacement | 0.0 |
Game Information

Location: Boston, Massachusetts
Attendance: 36,021 | Capacity: