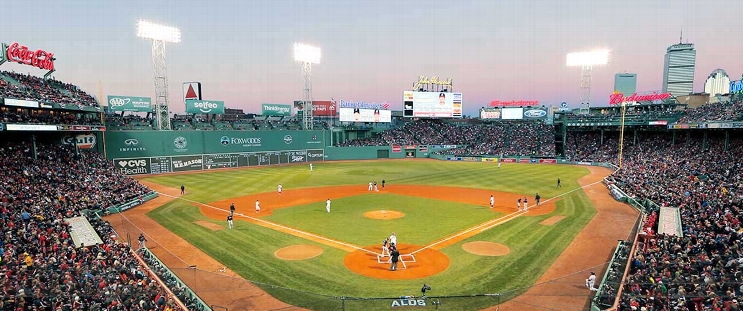
Cleveland Guardians at Boston Red Sox
· Major League Baseball
7 - 11

Bregman's clutch hit in the 8th helps Red Sox rally past Guardians 11-7

Jarren Duran and Trevor Story followed with RBI doubles off Cade Smith (6-6) for Boston’s second four-run inning of the game. Justin Slaten (2-4) earned the win with a perfect eighth inning.
Ceddanne Rafaela had two hits, including a two-run homer to tie the game in the bottom of the sixth after Cleveland scored six in the top half to take a 7-5 lead. Masataka Yoshida had three hits, including a pair of doubles, to help the Red Sox to their 10th win in 13 games.
Jhonkensy Noel had three hits for Cleveland, including a homer.
Boston scored four in the second and took a 5-1 lead into sixth before Cleveland tagged Red Sox starter Garrett Crochet for six runs. Austin Hedges led off with a homer, David Fry added a two-run shot, and Brayan Rocchio hit a three-run homer to make it 7-5.
The Red Sox tied it in the bottom half on Rafaela's two-run home run that cleared the seats above the Green Monster and landed on Lansdowne Street.
How can I watch Cleveland Guardians vs. Boston Red Sox?
- TV Channel: Guardians at Red Sox 2022 MLB Baseball, is broadcasted on MLB.TV.
- Online streaming: Sign up for Fubo.
Scoring Summary
 |
9th Inning | Kwan lined out to shortstop. |
 |
9th Inning | Hedges flied out to center. |
 |
9th Inning | Jones flied out to left. |
 |
9th Inning | Rafaela in center field. |
 |
9th Inning | Hamilton at second base. |
 |
9th Inning | Bernardino relieved Refsnyder |
Statistics
 CLE CLE |
 BOS BOS |
|
|---|---|---|
| 1 | Games Played | 1 |
| 1 | Team Games Played | 1 |
| 0 | Hit By Pitch | 0 |
| 12 | Ground Balls | 10 |
| 6 | Strikeouts | 11 |
| 7 | Runs Batted In | 11 |
| 0 | Sacrifice Hit | 0 |
| 11 | Hits | 18 |
| 0 | Stolen Bases | 1 |
| 0 | Walks | 0 |
| 0 | Catcher Interference | 0 |
| 7 | Runs | 11 |
| 1 | Ground Into Double Play | 0 |
| 0 | Sacrifice Flies | 0 |
| 37 | At Bats | 41 |
| 4 | Home Runs | 2 |
| 0 | Grand Slam Home Runs | 0 |
| 7 | Runners Left On Base | 10 |
| 0 | Triples | 0 |
| 0 | Game Winning RBIs | 1 |
| 0 | Intentional Walks | 0 |
| 0 | Doubles | 6 |
| 19 | Fly Balls | 20 |
| 0 | Caught Stealing | 0 |
| 120 | Pitches | 132 |
| 0 | Games Started | 0 |
| 0 | Pinch At Bats | 1 |
| 0 | Pinch Hits | 0 |
| 0.0 | Player Rating | 0.0 |
| 1 | Is Qualified | 1 |
| 0 | Is Qualified In Steals | 1 |
| 23 | Total Bases | 30 |
| 37 | Plate Appearances | 41 |
| 648.0 | Projected Home Runs | 324.0 |
| 4 | Extra Base Hits | 8 |
| 6.4 | Runs Created | 11.5 |
| .297 | Batting Average | .439 |
| .000 | Pinch Hit Average | .000 |
| .622 | Slugging Percentage | .732 |
| .324 | Secondary Average | .317 |
| .297 | On Base Percentage | .439 |
| .919 | OBP Pct + SLG Pct | 1.171 |
| 0.6 | Ground To Fly Ball Ratio | 0.5 |
| 6.4 | Runs Created Per 27 Outs | 13.5 |
| 51.0 | Batter Rating | 81.0 |
| 9.3 | At Bats Per Home Run | 20.5 |
| 0.00 | Stolen Base Percentage | 1.00 |
| 3.24 | Pitches Per Plate Appearance | 3.22 |
| .324 | Isolated Power | .293 |
| 0.00 | Walk To Strikeout Ratio | 0.00 |
| .000 | Walks Per Plate Appearance | .000 |
| .027 | Secondary Average Minus Batting Average | -.122 |
| 14.0 | Runs Produced | 22.0 |
| 1.0 | Runs Ratio | 1.0 |
| 0.6 | Patience Ratio | 0.7 |
| 0.3 | Balls In Play Average | 0.6 |
| 99.0 | MLB Rating | 120.8 |
| 0.0 | Offensive Wins Above Replacement | 0.0 |
| 0.0 | Wins Above Replacement | 0.0 |
Game Information

Location: Boston, Massachusetts
Attendance: 34,902 | Capacity:
2025 American League Central Standings
| TEAM | W | L | PCT | GB | STRK |
|---|---|---|---|---|---|
 Detroit Detroit |
81 | 60 | .574 | - | W1 |
 Kansas City Kansas City |
70 | 69 | .504 | 10 | L3 |
 Cleveland Cleveland |
69 | 69 | .500 | 10.5 | W1 |
 Minnesota Minnesota |
62 | 77 | .446 | 18 | L3 |
 Chicago Chicago |
52 | 88 | .371 | 28.5 | W4 |
2025 American League East Standings
| TEAM | W | L | PCT | GB | STRK |
|---|---|---|---|---|---|
 Toronto Toronto |
81 | 59 | .579 | - | W2 |
 New York New York |
77 | 62 | .554 | 3.5 | L1 |
 Boston Boston |
78 | 63 | .553 | 3.5 | L1 |
 Tampa Bay Tampa Bay |
70 | 69 | .504 | 10.5 | W6 |
 Baltimore Baltimore |
64 | 76 | .457 | 17 | W3 |