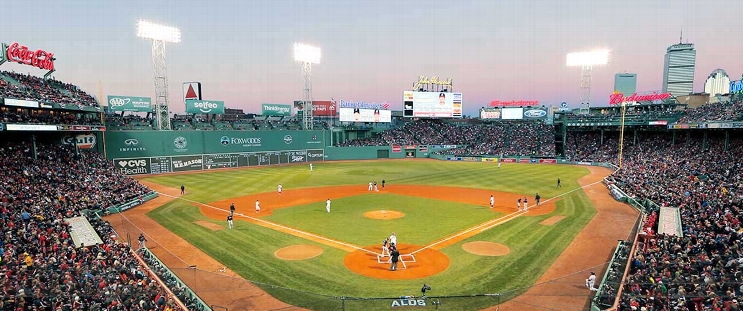
Cleveland Guardians at Boston Red Sox
· Major League Baseball
8 - 1

Guardians score 6 runs in 2nd inning and beat sloppy Red Sox 8-1 to prevent series sweep

Steven Kwan had three hits and scored twice for the Guardians, and José Ramírez drove in two runs. Rookie left-hander Joey Cantillo (4-3) pitched six impressive innings, giving up one run on five hits and two walks with seven strikeouts.
Boston threw a pair of wild pitches in the first two innings and committed two costly errors in the second. The Red Sox began the day leading the majors with 103 errors this season.
Kwan doubled off opener Brennan Bernardino (4-3) to begin the game, went to third on a wild pitch and scored on Ramírez's groundout.
Jordan Hicks gave up a leadoff double to Bo Naylor in the second, and Arias launched his 10th homer of the season. Hicks permitted two more hits before Steven Matz allowed an RBI single to Kwan that made it 4-0.
Cleveland got another run when Boston catcher Connor Wong was called for interference. Kwan scored on Matz's wild pitch, and left fielder Jarren Duran misplayed Kyle Manzardo’s flyball for an error that allowed another run to score.
Boston, which won the season series 4-2, scored in the fourth when Nick Sogard’s two-out single knocked in Rob Refsnyder.
Boston is off Thursday before playing Friday night at Arizona.
How can I watch Cleveland Guardians vs. Boston Red Sox?
- TV Channel: Guardians at Red Sox 2022 MLB Baseball, is broadcasted on MLB.TV.
- Online streaming: Sign up for Fubo.
Scoring Summary
 |
9th Inning | Sánchez struck out swinging. |
 |
9th Inning | Sogard lined out to left. |
 |
9th Inning | Rafaela lined out to center. |
 |
9th Inning | Noel flied out to left. |
 |
9th Inning | Manzardo lined out to first. |
 |
9th Inning | Ramírez flied out to center. |
Statistics
 CLE CLE |
 BOS BOS |
|
|---|---|---|
| 1 | Games Played | 1 |
| 1 | Team Games Played | 1 |
| 0 | Hit By Pitch | 0 |
| 9 | Ground Balls | 10 |
| 6 | Strikeouts | 10 |
| 7 | Runs Batted In | 1 |
| 0 | Sacrifice Hit | 0 |
| 12 | Hits | 7 |
| 0 | Stolen Bases | 0 |
| 3 | Walks | 2 |
| 0 | Catcher Interference | 0 |
| 8 | Runs | 1 |
| 1 | Ground Into Double Play | 0 |
| 1 | Sacrifice Flies | 0 |
| 36 | At Bats | 34 |
| 1 | Home Runs | 0 |
| 0 | Grand Slam Home Runs | 0 |
| 17 | Runners Left On Base | 17 |
| 0 | Triples | 0 |
| 1 | Game Winning RBIs | 0 |
| 0 | Intentional Walks | 0 |
| 4 | Doubles | 1 |
| 23 | Fly Balls | 14 |
| 0 | Caught Stealing | 0 |
| 163 | Pitches | 152 |
| 0 | Games Started | 0 |
| 1 | Pinch At Bats | 2 |
| 1 | Pinch Hits | 0 |
| 0.0 | Player Rating | 0.0 |
| 1 | Is Qualified | 1 |
| 0 | Is Qualified In Steals | 0 |
| 19 | Total Bases | 8 |
| 40 | Plate Appearances | 36 |
| 162.0 | Projected Home Runs | 0.0 |
| 5 | Extra Base Hits | 1 |
| 6.8 | Runs Created | 1.8 |
| .333 | Batting Average | .206 |
| 1.000 | Pinch Hit Average | .000 |
| .528 | Slugging Percentage | .235 |
| .278 | Secondary Average | .088 |
| .375 | On Base Percentage | .250 |
| .903 | OBP Pct + SLG Pct | .485 |
| 0.4 | Ground To Fly Ball Ratio | 0.7 |
| 7.1 | Runs Created Per 27 Outs | 1.8 |
| 53.0 | Batter Rating | 13.0 |
| 36.0 | At Bats Per Home Run | 0.0 |
| 0.00 | Stolen Base Percentage | 0.00 |
| 4.08 | Pitches Per Plate Appearance | 4.22 |
| .194 | Isolated Power | .029 |
| 0.50 | Walk To Strikeout Ratio | 0.20 |
| .075 | Walks Per Plate Appearance | .056 |
| -.056 | Secondary Average Minus Batting Average | -.118 |
| 15.0 | Runs Produced | 2.0 |
| 0.9 | Runs Ratio | 1.0 |
| 0.6 | Patience Ratio | 0.3 |
| 0.4 | Balls In Play Average | 0.3 |
| 98.5 | MLB Rating | 67.3 |
| 0.0 | Offensive Wins Above Replacement | 0.0 |
| 0.0 | Wins Above Replacement | 0.0 |
Game Information

Location: Boston, Massachusetts
Attendance: 36,658 | Capacity: