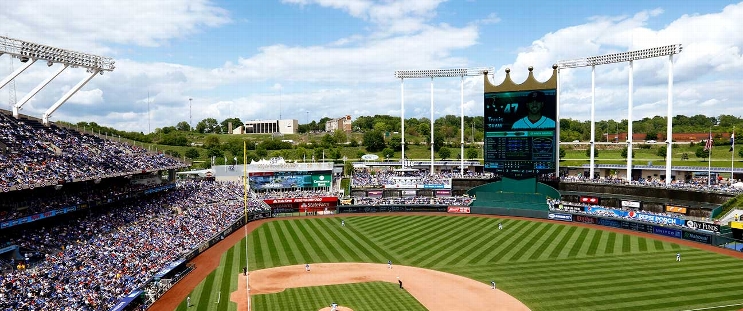
Los Angeles Angels at Kansas City Royals
· Major League Baseball
4 - 3

Jo Adell a one-man show for Angels in 4-3 win over Royals

Adell hit a go-ahead homer in the sixth inning for the second consecutive game. His three-run shot to center field on the first pitch he saw from reliever John Schreiber gave the Angels a 3-2 lead in this one.
Yoán Moncada, aboard on a single when Adell went deep, doubled off Lucas Erceg (6-4) in the eighth before scoring on Adell’s two-out single for a 4-3 advantage. Adell’s 33 homers and 90 RBI are career highs.
Reid Detmers struck out two in the ninth for his third save.
Angels star Mike Trout sat out again after getting scratched from the lineup Tuesday night because of a skin infection on his left arm.
Salvador Perez had a one-out double in the seventh for the Royals off winning pitcher Robert Stephenson (1-0). It was his 33rd double this season and the 625th extra-base hit of his career, tying Frank White for third on the franchise list. Adam Frazier doubled to tie it at 3.
Mike Yastrzemski had a sacrifice fly in the first inning to help the Royals take a 2-0 lead against Caden Dana, making his first start this season and the fourth of his career. Dana allowed two hits and one earned run over five innings.
Royals rookie Ryan Bergert gave up one hit and left with a 2-0 lead after issuing a leadoff walk to Zach Neto in the sixth. Bergert struck out six and walked three.
Kansas City (70-69) has lost three in a row and seven of 11.
How can I watch Los Angeles Angels vs. Kansas City Royals?
- TV Channel: Angels at Royals 2022 MLB Baseball, is broadcasted on MLB.TV.
- Online streaming: Sign up for Fubo.
Scoring Summary
 |
9th Inning | Frazier struck out swinging. |
 |
9th Inning | Loftin struck out looking. |
 |
9th Inning | Loftin hit for Maile |
 |
9th Inning | Garcia lined out to center. |
 |
9th Inning | Detmers relieved Chafin |
 |
9th Inning | Teodosio popped out to first. |
Statistics
 LAA LAA |
 KC KC |
|
|---|---|---|
| 1 | Games Played | 1 |
| 1 | Team Games Played | 1 |
| 0 | Hit By Pitch | 1 |
| 7 | Ground Balls | 9 |
| 9 | Strikeouts | 8 |
| 4 | Runs Batted In | 2 |
| 0 | Sacrifice Hit | 1 |
| 5 | Hits | 4 |
| 2 | Stolen Bases | 0 |
| 4 | Walks | 2 |
| 0 | Catcher Interference | 0 |
| 4 | Runs | 3 |
| 0 | Ground Into Double Play | 1 |
| 0 | Sacrifice Flies | 1 |
| 32 | At Bats | 28 |
| 1 | Home Runs | 0 |
| 0 | Grand Slam Home Runs | 0 |
| 12 | Runners Left On Base | 9 |
| 0 | Triples | 0 |
| 1 | Game Winning RBIs | 0 |
| 0 | Intentional Walks | 0 |
| 1 | Doubles | 2 |
| 16 | Fly Balls | 13 |
| 0 | Caught Stealing | 1 |
| 153 | Pitches | 133 |
| 0 | Games Started | 0 |
| 0 | Pinch At Bats | 2 |
| 0 | Pinch Hits | 0 |
| 0.0 | Player Rating | 0.0 |
| 1 | Is Qualified | 1 |
| 1 | Is Qualified In Steals | 1 |
| 9 | Total Bases | 6 |
| 36 | Plate Appearances | 33 |
| 162.0 | Projected Home Runs | 0.0 |
| 2 | Extra Base Hits | 2 |
| 2.7 | Runs Created | 0.5 |
| .156 | Batting Average | .143 |
| .000 | Pinch Hit Average | .000 |
| .281 | Slugging Percentage | .214 |
| .313 | Secondary Average | .107 |
| .250 | On Base Percentage | .219 |
| .531 | OBP Pct + SLG Pct | .433 |
| 0.4 | Ground To Fly Ball Ratio | 0.7 |
| 2.7 | Runs Created Per 27 Outs | 0.5 |
| 28.0 | Batter Rating | 18.0 |
| 32.0 | At Bats Per Home Run | 0.0 |
| 1.00 | Stolen Base Percentage | 0.00 |
| 4.25 | Pitches Per Plate Appearance | 4.03 |
| .125 | Isolated Power | .071 |
| 0.44 | Walk To Strikeout Ratio | 0.25 |
| .111 | Walks Per Plate Appearance | .061 |
| .156 | Secondary Average Minus Batting Average | -.036 |
| 8.0 | Runs Produced | 5.0 |
| 1.0 | Runs Ratio | 0.7 |
| 0.4 | Patience Ratio | 0.3 |
| 0.2 | Balls In Play Average | 0.2 |
| 73.5 | MLB Rating | 67.0 |
| 0.0 | Offensive Wins Above Replacement | 0.0 |
| 0.0 | Wins Above Replacement | 0.0 |
Game Information

Location: Kansas City, Missouri
Attendance: 15,924 | Capacity: