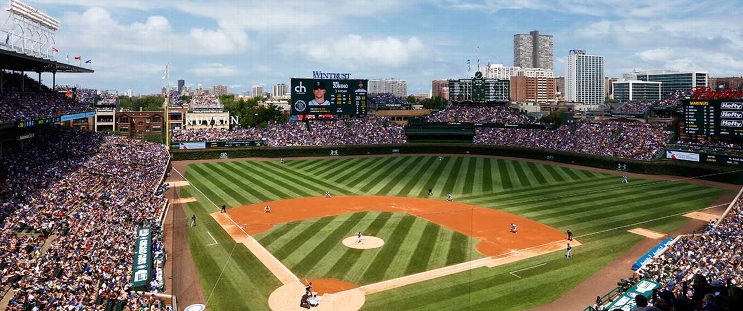
Atlanta Braves at Chicago Cubs
· Major League Baseball
5 - 1

Kim, Albies homer late to back Elder as Braves rally past Cubs 5-1

Ozzie Albies added a solo shot the eighth and hit a single in the seventh that broke up a combined no-hit bid by Chicago.
Elder (6-9) allowed one unearned run while striking out six and walking none. The right-hander retired 15 of the last 17 hitters he faced.
Tyler Kinley pitched a perfect eighth, then Raisel Iglesias worked around two walks in the ninth to complete a four-hitter.
Claimed on waivers from Tampa Bay on Monday, Kim drove the first pitch he saw from reliever Drew Pomeranz in the seventh inning 391 feet into the left-center bleachers to put the Braves up 3-1.
Willi Castro hit at RBI single in the second to give Chicago a 1-0 lead.
The Braves scored four times on four hits and a walk in the seventh after Cubs rookie Cade Horton and reliever Ben Brown did not give up a hit through six innings.
Horton allowed only one walk and struck out six through five innings. He was replaced by Brown to start the sixth after throwing 75 pitches and retiring the last 14 hitters he faced.
Brown (5-8) struck out three and walked one in the sixth. He was charged with two runs off a hit and walk while getting one out in the seventh.
How can I watch Atlanta Braves vs. Chicago Cubs?
- TV Channel: Braves at Cubs 2022 MLB Baseball, is broadcasted on MLB.TV.
- Online streaming: Sign up for Fubo.
Scoring Summary
 |
9th Inning | Santana struck out looking. |
 |
9th Inning | Happ walked. |
 |
9th Inning | Suzuki to second on fielder's indifference. |
 |
9th Inning | Suzuki walked. |
 |
9th Inning | Busch lined out to center. |
 |
9th Inning | Hoerner grounded out to second. |
Statistics
 ATL ATL |
 CHC CHC |
|
|---|---|---|
| 1 | Games Played | 1 |
| 1 | Team Games Played | 1 |
| 0 | Hit By Pitch | 0 |
| 7 | Ground Balls | 8 |
| 12 | Strikeouts | 9 |
| 5 | Runs Batted In | 1 |
| 0 | Sacrifice Hit | 0 |
| 6 | Hits | 4 |
| 1 | Stolen Bases | 1 |
| 3 | Walks | 2 |
| 0 | Catcher Interference | 0 |
| 5 | Runs | 1 |
| 0 | Ground Into Double Play | 0 |
| 0 | Sacrifice Flies | 0 |
| 33 | At Bats | 30 |
| 2 | Home Runs | 0 |
| 0 | Grand Slam Home Runs | 0 |
| 9 | Runners Left On Base | 8 |
| 0 | Triples | 0 |
| 1 | Game Winning RBIs | 0 |
| 0 | Intentional Walks | 0 |
| 0 | Doubles | 0 |
| 14 | Fly Balls | 13 |
| 0 | Caught Stealing | 1 |
| 156 | Pitches | 138 |
| 0 | Games Started | 0 |
| 0 | Pinch At Bats | 0 |
| 0 | Pinch Hits | 0 |
| 0.0 | Player Rating | 0.0 |
| 1 | Is Qualified | 1 |
| 1 | Is Qualified In Steals | 1 |
| 12 | Total Bases | 4 |
| 36 | Plate Appearances | 32 |
| 324.0 | Projected Home Runs | 0.0 |
| 2 | Extra Base Hits | 0 |
| 3.2 | Runs Created | -0.1 |
| .182 | Batting Average | .133 |
| .000 | Pinch Hit Average | .000 |
| .364 | Slugging Percentage | .133 |
| .303 | Secondary Average | .067 |
| .250 | On Base Percentage | .188 |
| .614 | OBP Pct + SLG Pct | .321 |
| 0.5 | Ground To Fly Ball Ratio | 0.6 |
| 3.2 | Runs Created Per 27 Outs | -0.1 |
| 33.0 | Batter Rating | 9.0 |
| 16.5 | At Bats Per Home Run | 0.0 |
| 1.00 | Stolen Base Percentage | 0.50 |
| 4.33 | Pitches Per Plate Appearance | 4.31 |
| .182 | Isolated Power | .000 |
| 0.25 | Walk To Strikeout Ratio | 0.22 |
| .083 | Walks Per Plate Appearance | .063 |
| .121 | Secondary Average Minus Batting Average | -.067 |
| 10.0 | Runs Produced | 2.0 |
| 1.0 | Runs Ratio | 1.0 |
| 0.4 | Patience Ratio | 0.2 |
| 0.2 | Balls In Play Average | 0.2 |
| 78.3 | MLB Rating | 60.8 |
| 0.0 | Offensive Wins Above Replacement | 0.0 |
| 0.0 | Wins Above Replacement | 0.0 |
Game Information

Location: Chicago, Illinois
Attendance: 31,933 | Capacity: