
Philadelphia Phillies at Milwaukee Brewers
· Major League Baseball
3 - 6

Isaac Collins hits 3-run HR, Jose Quintana pitches into 7th as Brewers beat Phillies 6-3

Milwaukee (86-54) and Philadelphia (80-59) entered with the two best records in the National League. The Brewers increased their Central Division lead to six games over the Cubs, who lost 5-1 to Atlanta. The Phillies remained 5 1/2 games up in the East over the Mets, who lost 6-2 at Detroit.
Collins' drive capped a five-run first inning against Aaron Nola (3-8). Brice Turang walked to open, Jackson Chourio was hit by a pitch and William Contreras singled to load the bases. Sal Frelick followed with an RBI single and Chourio continued home on a throwing error by center fielder Harrison Bader. Collins then sent a 1-0 pitch 358 feet to right for his ninth homer.
The Brewers added a run in the fourth when Jake Bauers snapped an 0-for-20 skid with a leadoff single and Turang doubled with two outs.
Trea Turner answered with an RBI single in the fifth to make 6-1.
Weston Wilson hit a two-run homer in the seventh to chase Quintana and pull the Phillies to 6-3.
Quintana (11-5) allowed three runs and seven hits in 6 1/3 innings, striking out six and walking three. Jared Koenig tossed a scoreless ninth for his first save.
How can I watch Philadelphia Phillies vs. Milwaukee Brewers?
- TV Channel: Phillies at Brewers 2022 MLB Baseball, is broadcasted on NBC Sports Phil.
- Online streaming: Sign up for Fubo.
Scoring Summary
 |
9th Inning | Schwarber grounded out to second. |
|
9th Inning | Wilson to second on fielder's indifference. |
|
9th Inning | Turner struck out swinging. |
|
9th Inning | Wilson hit by pitch. |
|
9th Inning | Sosa flied out to center. |
 |
9th Inning | Koenig relieved Uribe |
Statistics
 PHI PHI |
 MIL MIL |
|
|---|---|---|
| 1 | Games Played | 1 |
| 1 | Team Games Played | 1 |
| 1 | Hit By Pitch | 1 |
| 17 | Ground Balls | 5 |
| 9 | Strikeouts | 8 |
| 3 | Runs Batted In | 5 |
| 0 | Sacrifice Hit | 0 |
| 9 | Hits | 6 |
| 0 | Stolen Bases | 2 |
| 4 | Walks | 4 |
| 0 | Catcher Interference | 0 |
| 3 | Runs | 6 |
| 3 | Ground Into Double Play | 2 |
| 0 | Sacrifice Flies | 0 |
| 33 | At Bats | 28 |
| 1 | Home Runs | 1 |
| 0 | Grand Slam Home Runs | 0 |
| 18 | Runners Left On Base | 10 |
| 0 | Triples | 1 |
| 0 | Game Winning RBIs | 1 |
| 0 | Intentional Walks | 0 |
| 0 | Doubles | 1 |
| 7 | Fly Balls | 15 |
| 0 | Caught Stealing | 0 |
| 145 | Pitches | 141 |
| 0 | Games Started | 0 |
| 0 | Pinch At Bats | 0 |
| 0 | Pinch Hits | 0 |
| 0.0 | Player Rating | 0.0 |
| 1 | Is Qualified | 1 |
| 0 | Is Qualified In Steals | 1 |
| 12 | Total Bases | 12 |
| 38 | Plate Appearances | 33 |
| 162.0 | Projected Home Runs | 162.0 |
| 1 | Extra Base Hits | 3 |
| 3.8 | Runs Created | 4.0 |
| .273 | Batting Average | .214 |
| .000 | Pinch Hit Average | .000 |
| .364 | Slugging Percentage | .429 |
| .212 | Secondary Average | .429 |
| .368 | On Base Percentage | .333 |
| .732 | OBP Pct + SLG Pct | .762 |
| 2.4 | Ground To Fly Ball Ratio | 0.3 |
| 3.8 | Runs Created Per 27 Outs | 4.5 |
| 24.0 | Batter Rating | 37.5 |
| 33.0 | At Bats Per Home Run | 28.0 |
| 0.00 | Stolen Base Percentage | 1.00 |
| 3.82 | Pitches Per Plate Appearance | 4.27 |
| .091 | Isolated Power | .214 |
| 0.44 | Walk To Strikeout Ratio | 0.50 |
| .105 | Walks Per Plate Appearance | .121 |
| -.061 | Secondary Average Minus Batting Average | .214 |
| 6.0 | Runs Produced | 11.0 |
| 1.0 | Runs Ratio | 0.8 |
| 0.5 | Patience Ratio | 0.5 |
| 0.3 | Balls In Play Average | 0.3 |
| 79.0 | MLB Rating | 82.3 |
| 0.0 | Offensive Wins Above Replacement | 0.0 |
| 0.0 | Wins Above Replacement | 0.0 |
Game Information
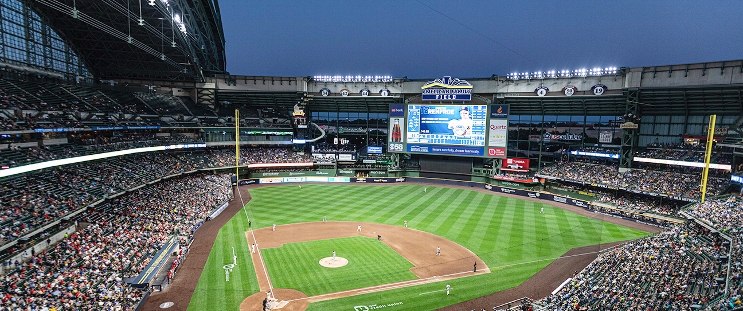
Location: Milwaukee, Wisconsin
Attendance: 28,528 | Capacity:
2026 National League East Standings
| TEAM | W | L | PCT | GB | STRK |
|---|---|---|---|---|---|
| <img src="https://a.espncdn.com/i/teamlogos/mlb/500/atl.png" class="logo-micro">Atlanta | 50 | 35 | .588 | - | L1 |
| <img src="https://a.espncdn.com/i/teamlogos/mlb/500/phi.png" class="logo-micro">Philadelphia | 49 | 39 | .557 | 2.5 | L1 |
| <img src="https://a.espncdn.com/i/teamlogos/mlb/500/mia.png" class="logo-micro">Miami | 46 | 42 | .523 | 5.5 | L2 |
| <img src="https://a.espncdn.com/i/teamlogos/mlb/500/wsh.png" class="logo-micro">Washington | 45 | 43 | .511 | 6.5 | W2 |
| <img src="https://a.espncdn.com/i/teamlogos/mlb/500/nym.png" class="logo-micro">New York | 36 | 51 | .414 | 15 | L1 |
2026 National League Central Standings
| TEAM | W | L | PCT | GB | STRK |
|---|---|---|---|---|---|
| <img src="https://a.espncdn.com/i/teamlogos/mlb/500/mil.png" class="logo-micro">Milwaukee | 53 | 32 | .624 | - | L1 |
| <img src="https://a.espncdn.com/i/teamlogos/mlb/500/chc.png" class="logo-micro">Chicago | 49 | 39 | .557 | 5.5 | L1 |
| <img src="https://a.espncdn.com/i/teamlogos/mlb/500/stl.png" class="logo-micro">St. Louis | 46 | 39 | .541 | 7 | W2 |
| <img src="https://a.espncdn.com/i/teamlogos/mlb/500/pit.png" class="logo-micro">Pittsburgh | 44 | 44 | .500 | 10.5 | W1 |
| <img src="https://a.espncdn.com/i/teamlogos/mlb/500/cin.png" class="logo-micro">Cincinnati | 40 | 46 | .465 | 13.5 | W1 |