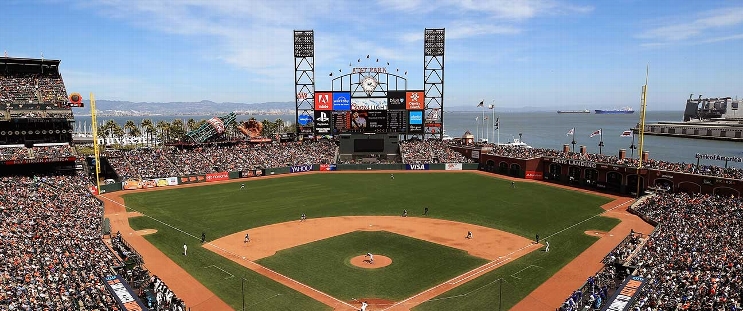
Arizona Diamondbacks at San Francisco Giants
· Major League Baseball
5 - 11

Logan Webb pitches 6 solid innings, Giants hit 5 homers in 11-5 win over Diamondbacks

Webb (14-9) allowed four runs — one earned — on five hits with two walks and seven strikeouts.
Jung Hoo Lee, Dominic Smith, Heliot Ramos, Matt Chapman and Patrick Bailey each hit a home run.
San Francisco has won 12 of 15. The Giants (73-71) are three games behind the New York Mets for the final wild card spot in the National League, 1 1/2 games in front of the Diamondbacks.
The Giants scored five times in the sixth inning to break a 4-all tie. Reliever Brandyn Garcia (0-1) was charged with the first three runs (two earned).
Jake McCarthy tripled with the bases loaded to give Arizona a 3-0 lead in the second inning and Blaze Alexander hit a two-out single that drove in Ketel Marte in the third. Gabriel Moreno homered to lead off the eighth.
Arizona's Corbin Carroll was 0 for 4 and had his 24-game on-base streak snapped.
How can I watch Arizona Diamondbacks vs. San Francisco Giants?
- TV Channel: Diamondbacks at Giants 2022 MLB Baseball, is broadcasted on FS1.
- Online streaming: Sign up for Fubo.
Scoring Summary
 |
9th Inning | Marte grounded out to second. |
 |
9th Inning | Perdomo flied out to left. |
 |
9th Inning | McCarthy struck out looking. |
 |
9th Inning | Vargas reached on infield single to shortstop. |
 |
8th Inning | Devers lined out to center. |
 |
8th Inning | Ramos struck out swinging. |
Statistics
 ARI ARI |
 SF SF |
|
|---|---|---|
| 1 | Games Played | 1 |
| 1 | Team Games Played | 1 |
| 0 | Hit By Pitch | 0 |
| 13 | Ground Balls | 11 |
| 10 | Strikeouts | 6 |
| 5 | Runs Batted In | 11 |
| 0 | Sacrifice Hit | 0 |
| 8 | Hits | 12 |
| 1 | Stolen Bases | 0 |
| 2 | Walks | 2 |
| 0 | Catcher Interference | 0 |
| 5 | Runs | 11 |
| 0 | Ground Into Double Play | 1 |
| 0 | Sacrifice Flies | 1 |
| 36 | At Bats | 35 |
| 1 | Home Runs | 5 |
| 0 | Grand Slam Home Runs | 0 |
| 17 | Runners Left On Base | 8 |
| 1 | Triples | 0 |
| 0 | Game Winning RBIs | 1 |
| 0 | Intentional Walks | 0 |
| 0 | Doubles | 2 |
| 13 | Fly Balls | 19 |
| 0 | Caught Stealing | 0 |
| 144 | Pitches | 121 |
| 0 | Games Started | 0 |
| 0 | Pinch At Bats | 0 |
| 0 | Pinch Hits | 0 |
| 0.0 | Player Rating | 0.0 |
| 1 | Is Qualified | 1 |
| 1 | Is Qualified In Steals | 0 |
| 13 | Total Bases | 29 |
| 38 | Plate Appearances | 38 |
| 162.0 | Projected Home Runs | 810.0 |
| 2 | Extra Base Hits | 7 |
| 3.6 | Runs Created | 9.6 |
| .222 | Batting Average | .343 |
| .000 | Pinch Hit Average | .000 |
| .361 | Slugging Percentage | .829 |
| .222 | Secondary Average | .543 |
| .263 | On Base Percentage | .368 |
| .624 | OBP Pct + SLG Pct | 1.197 |
| 1.0 | Ground To Fly Ball Ratio | 0.6 |
| 3.5 | Runs Created Per 27 Outs | 10.4 |
| 34.5 | Batter Rating | 75.0 |
| 36.0 | At Bats Per Home Run | 7.0 |
| 1.00 | Stolen Base Percentage | 0.00 |
| 3.79 | Pitches Per Plate Appearance | 3.18 |
| .139 | Isolated Power | .486 |
| 0.20 | Walk To Strikeout Ratio | 0.33 |
| .053 | Walks Per Plate Appearance | .053 |
| .000 | Secondary Average Minus Batting Average | .200 |
| 10.0 | Runs Produced | 22.0 |
| 1.0 | Runs Ratio | 1.0 |
| 0.4 | Patience Ratio | 0.9 |
| 0.3 | Balls In Play Average | 0.3 |
| 81.3 | MLB Rating | 115.5 |
| 0.0 | Offensive Wins Above Replacement | 0.0 |
| 0.0 | Wins Above Replacement | 0.0 |
Game Information

Location: San Francisco, California
Attendance: 26,699 | Capacity:
2025 National League West Standings
| TEAM | W | L | PCT | GB | STRK |
|---|---|---|---|---|---|
 Los Angeles Los Angeles |
80 | 64 | .556 | - | W2 |
 San Diego San Diego |
79 | 65 | .549 | 1 | W3 |
 San Francisco San Francisco |
73 | 71 | .507 | 7 | W1 |
 Arizona Arizona |
72 | 73 | .497 | 8.5 | L2 |
 Colorado Colorado |
40 | 104 | .278 | 40 | L3 |