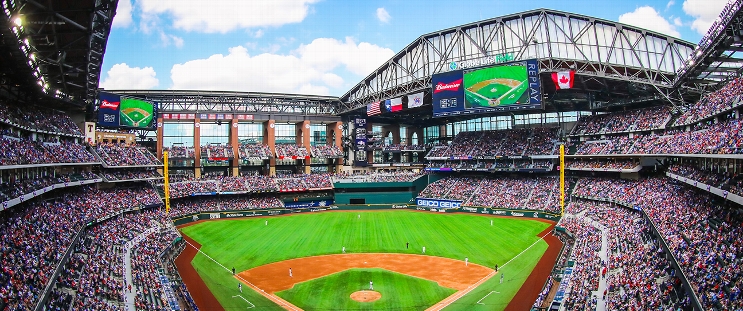
Milwaukee Brewers at Texas Rangers
· Major League Baseball
4 - 5

Michael Helman hits 2-run HR, make catch to prevent 2-run HR, as Rangers beat Brewers 5-4

Wyatt Langford’s RBI triple and Kyle Higashioka’s run-scoring single off Aaron Ashby (3-2) capped the Rangers’ rally after Milwaukee scored three times in the top of the fifth.
Hoby Milner (3-4) pitched a scoreless inning of relief after allowing six runs in two-thirds of an inning in his two previous outings. Shawn Armstrong earned his eighth save in 11 opportunities despite giving up a pinch-hit home run to Jake Bauers.
Texas has won 13 of its last 17 games to cut a 7 1/2-game deficit behind first-place Houston in the AL West to 2 1/2 games.
Helman, a rookie claimed off waivers from Pittsburgh on May 19, was the star of the Rangers’ 5-0 win in Monday night’s series opener. The Texas A&M product hit his first major league grand slam and had five RBI.
In a matchup of rookie starters, neither Texas’ Jack Leiter nor Milwaukee’s Chad Patrick, called up from Triple-A Nashville, made it through five innings.
After Helman’s catch to rob Brice Turang for the second out in the fifth, the Brewers scored three runs on an RBI comebacker by Christian Yelich that Leiter knocked down but bobbled and William Contreras’ two-run single.
How can I watch Milwaukee Brewers vs. Texas Rangers?
- TV Channel: Brewers at Rangers 2022 MLB Baseball, is broadcasted on MLB.TV.
- Online streaming: Sign up for Fubo.
Scoring Summary
 |
9th Inning | Yelich lined out to center. |
 |
9th Inning | Chourio singled to left. |
 |
9th Inning | Turang flied out to left. |
 |
9th Inning | Bauers homered to center (443 feet). |
 |
9th Inning | Bauers hit for Monasterio |
 |
9th Inning | Durbin flied out to center. |
Statistics
 MIL MIL |
 TEX TEX |
|
|---|---|---|
| 1 | Games Played | 1 |
| 1 | Team Games Played | 1 |
| 0 | Hit By Pitch | 0 |
| 12 | Ground Balls | 8 |
| 5 | Strikeouts | 11 |
| 4 | Runs Batted In | 5 |
| 0 | Sacrifice Hit | 0 |
| 11 | Hits | 7 |
| 3 | Stolen Bases | 0 |
| 2 | Walks | 4 |
| 0 | Catcher Interference | 0 |
| 4 | Runs | 5 |
| 1 | Ground Into Double Play | 0 |
| 0 | Sacrifice Flies | 0 |
| 37 | At Bats | 30 |
| 1 | Home Runs | 1 |
| 0 | Grand Slam Home Runs | 0 |
| 13 | Runners Left On Base | 8 |
| 0 | Triples | 1 |
| 0 | Game Winning RBIs | 1 |
| 0 | Intentional Walks | 0 |
| 3 | Doubles | 1 |
| 20 | Fly Balls | 11 |
| 0 | Caught Stealing | 0 |
| 154 | Pitches | 145 |
| 0 | Games Started | 0 |
| 2 | Pinch At Bats | 1 |
| 1 | Pinch Hits | 1 |
| 0.0 | Player Rating | 0.0 |
| 1 | Is Qualified | 1 |
| 1 | Is Qualified In Steals | 0 |
| 17 | Total Bases | 13 |
| 39 | Plate Appearances | 34 |
| 162.0 | Projected Home Runs | 162.0 |
| 4 | Extra Base Hits | 3 |
| 5.9 | Runs Created | 4.4 |
| .297 | Batting Average | .233 |
| .500 | Pinch Hit Average | 1.000 |
| .459 | Slugging Percentage | .433 |
| .297 | Secondary Average | .333 |
| .333 | On Base Percentage | .324 |
| .793 | OBP Pct + SLG Pct | .757 |
| 0.6 | Ground To Fly Ball Ratio | 0.7 |
| 5.9 | Runs Created Per 27 Outs | 5.2 |
| 39.0 | Batter Rating | 34.5 |
| 37.0 | At Bats Per Home Run | 30.0 |
| 1.00 | Stolen Base Percentage | 0.00 |
| 3.95 | Pitches Per Plate Appearance | 4.26 |
| .162 | Isolated Power | .200 |
| 0.40 | Walk To Strikeout Ratio | 0.36 |
| .051 | Walks Per Plate Appearance | .118 |
| .000 | Secondary Average Minus Batting Average | .100 |
| 8.0 | Runs Produced | 10.0 |
| 1.0 | Runs Ratio | 1.0 |
| 0.5 | Patience Ratio | 0.5 |
| 0.3 | Balls In Play Average | 0.3 |
| 88.5 | MLB Rating | 81.5 |
| 0.0 | Offensive Wins Above Replacement | 0.0 |
| 0.0 | Wins Above Replacement | 0.0 |
Game Information

Location: Arlington, Texas
Attendance: 24,581 | Capacity:
2025 National League Central Standings
| TEAM | W | L | PCT | GB | STRK |
|---|---|---|---|---|---|
 Milwaukee Milwaukee |
89 | 57 | .610 | - | L2 |
 Chicago Chicago |
82 | 63 | .566 | 6.5 | W1 |
 Cincinnati Cincinnati |
73 | 72 | .503 | 15.5 | W1 |
 St. Louis St. Louis |
72 | 74 | .493 | 17 | L2 |
 Pittsburgh Pittsburgh |
64 | 81 | .441 | 24.5 | L4 |
2025 American League West Standings
| TEAM | W | L | PCT | GB | STRK |
|---|---|---|---|---|---|
 Houston Houston |
78 | 67 | .538 | - | L2 |
 Seattle Seattle |
77 | 68 | .531 | 1 | W4 |
 Texas Texas |
76 | 70 | .521 | 2.5 | W3 |
 Los Angeles Los Angeles |
68 | 77 | .469 | 10 | W1 |
 Athletics Athletics |
66 | 80 | .452 | 12.5 | L3 |