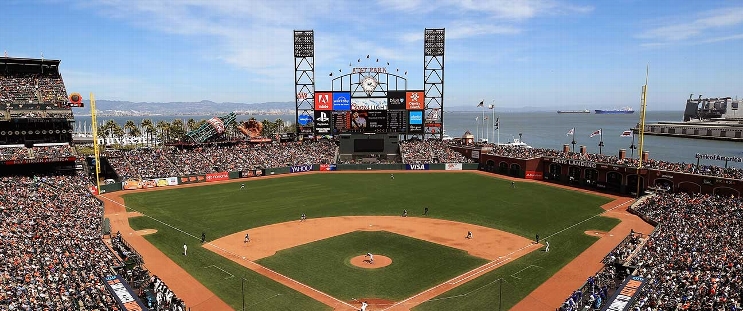
Arizona Diamondbacks at San Francisco Giants
· Major League Baseball
3 - 5

Willy Adames hits three-run homer as Giants beat D-backs 5-3, gain ground on Mets in wild-card chase

Patrick Bailey also homered and Casey Schmitt added a sacrifice fly in the fourth as the teams played through intermittent rain and a steady mist hovering above the diamond.
San Francisco pulled within two games of the Mets for the final NL wild card spot after New York lost at Philadelphia, but the Mets own the tiebreaker.
After the Giants' 11-5 win Monday featuring five home runs, Ryan Walker worked out of trouble in the ninth for his 15th save in 20 chances as San Francisco won for the eighth time in its last nine home games and 13th of 16 overall.
Zac Gallen (11-14) allowed five runs and five hits with three walks and three strikeouts, leaving him one strikeout shy of becoming third Arizona pitcher to reach 1,000. He did pass Ray (998) to move into third place on the D-backs' all-time strikeouts list behind Randy Johnson and Brandon Webb.
He saw former Diamondbacks great Ray (11-6) on the other side for the first time.
Ray struck out the side in order in the third, all swinging, including a nine-pitch battle with Ketel Marte to end the inning. Ray is 3-0 in as many starts against the D-backs, all of those wins this year.
Gallen had won five straight starts against NL West opponents and Arizona was 3-0 in his previous three road outings.
How can I watch Arizona Diamondbacks vs. San Francisco Giants?
- TV Channel: Diamondbacks at Giants 2022 MLB Baseball, is broadcasted on MLB.TV.
- Online streaming: Sign up for Fubo.
Scoring Summary
 |
9th Inning | Marte grounded out to second. |
 |
9th Inning | Thomas popped out to shortstop. |
 |
9th Inning | Thomas hit for Barrosa |
 |
9th Inning | Kaiser bunted into fielder's choice to first, Del Castillo to second, McCarthy out at third. |
 |
9th Inning | Kaiser hit for McCann |
 |
9th Inning | Del Castillo walked, McCarthy to second. |
Statistics
 ARI ARI |
 SF SF |
|
|---|---|---|
| 1 | Games Played | 1 |
| 1 | Team Games Played | 1 |
| 0 | Hit By Pitch | 0 |
| 10 | Ground Balls | 11 |
| 7 | Strikeouts | 5 |
| 3 | Runs Batted In | 5 |
| 0 | Sacrifice Hit | 0 |
| 8 | Hits | 5 |
| 1 | Stolen Bases | 0 |
| 3 | Walks | 3 |
| 0 | Catcher Interference | 0 |
| 3 | Runs | 5 |
| 1 | Ground Into Double Play | 1 |
| 1 | Sacrifice Flies | 1 |
| 33 | At Bats | 27 |
| 0 | Home Runs | 2 |
| 0 | Grand Slam Home Runs | 0 |
| 18 | Runners Left On Base | 5 |
| 0 | Triples | 0 |
| 0 | Game Winning RBIs | 1 |
| 0 | Intentional Walks | 0 |
| 2 | Doubles | 1 |
| 17 | Fly Balls | 12 |
| 0 | Caught Stealing | 0 |
| 161 | Pitches | 125 |
| 0 | Games Started | 0 |
| 4 | Pinch At Bats | 0 |
| 1 | Pinch Hits | 0 |
| 0.0 | Player Rating | 0.0 |
| 1 | Is Qualified | 1 |
| 1 | Is Qualified In Steals | 0 |
| 10 | Total Bases | 12 |
| 37 | Plate Appearances | 31 |
| 0.0 | Projected Home Runs | 324.0 |
| 2 | Extra Base Hits | 3 |
| 3.1 | Runs Created | 3.1 |
| .242 | Batting Average | .185 |
| .250 | Pinch Hit Average | .000 |
| .303 | Slugging Percentage | .444 |
| .182 | Secondary Average | .370 |
| .297 | On Base Percentage | .258 |
| .600 | OBP Pct + SLG Pct | .703 |
| 0.6 | Ground To Fly Ball Ratio | 0.9 |
| 3.1 | Runs Created Per 27 Outs | 3.5 |
| 25.0 | Batter Rating | 33.0 |
| 0.0 | At Bats Per Home Run | 13.5 |
| 1.00 | Stolen Base Percentage | 0.00 |
| 4.35 | Pitches Per Plate Appearance | 4.03 |
| .061 | Isolated Power | .259 |
| 0.43 | Walk To Strikeout Ratio | 0.60 |
| .081 | Walks Per Plate Appearance | .097 |
| -.061 | Secondary Average Minus Batting Average | .185 |
| 6.0 | Runs Produced | 10.0 |
| 1.0 | Runs Ratio | 1.0 |
| 0.4 | Patience Ratio | 0.5 |
| 0.3 | Balls In Play Average | 0.2 |
| 76.3 | MLB Rating | 80.3 |
| 0.0 | Offensive Wins Above Replacement | 0.0 |
| 0.0 | Wins Above Replacement | 0.0 |
Game Information

Location: San Francisco, California
Attendance: 30,883 | Capacity:
2025 National League West Standings
| TEAM | W | L | PCT | GB | STRK |
|---|---|---|---|---|---|
 Los Angeles Los Angeles |
81 | 64 | .559 | - | W3 |
 San Diego San Diego |
79 | 66 | .545 | 2 | L1 |
 San Francisco San Francisco |
74 | 71 | .510 | 7 | W2 |
 Arizona Arizona |
72 | 74 | .493 | 9.5 | L3 |
 Colorado Colorado |
40 | 105 | .276 | 41 | L4 |