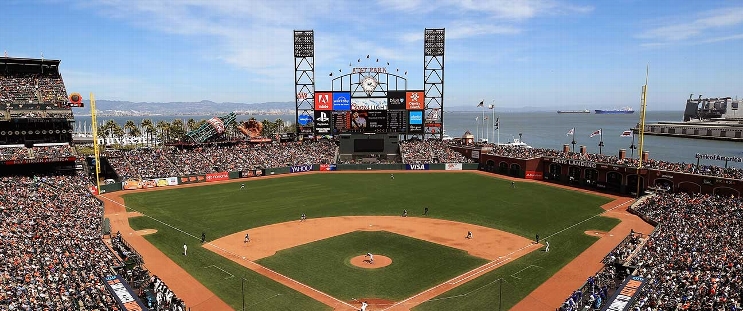
Los Angeles Dodgers at San Francisco Giants
· Major League Baseball
1 - 5

Patrick Bailey's game-ending grand slam sends surging Giants past first-place Dodgers, 5-1

Bailey crushed a 1-0 pitch from Tanner Scott into the left-field seats and was doused by teammates after his home run trot.
Joel Peguero (2-0) pitched the 10th for the win as San Francisco won for the eighth time in 11 games and pulled within a half-game of the Mets for the third NL wild card after New York lost at home to Texas.
The Giants missed a chance to end it in the ninth.
Pinch-hitter Luis Matos reached on Mookie Betts’ throwing error, Rafael Devers singled one out later and Blake Treinen (1-4) relieved Jack Dreyer. He intentionally walked Willy Adames to bring up Wilmer Flores, who hit a deep fly to center that Andy Pages fired to catcher Ben Rortvedt at 92.9 mph to tag Grant McCray for the inning-ending double play.
McCray then made a catch and 101.7 mph throw from right field to third for a double play in the top of the 10th.
Michael Conforto had tied it on a home run leading off the seventh against his old Giants team.
The Dodgers had their four-game winning streak snapped in the first game of seven important matchups between the clubs over a 10-day span.
Justin Verlander left with a no-decision as he reached 20 years of service time Friday. Verlander made his 552nd start to tie with Bartolo Colon for 28th place on the career list.
Smith injured his inner right thigh and was replaced by Wilmer Flores.
How can I watch Los Angeles Dodgers vs. San Francisco Giants?
- TV Channel: Dodgers at Giants 2022 MLB Baseball, is broadcasted on MLBN.
- Online streaming: Sign up for Fubo.
Scoring Summary
 |
10th Inning | Bailey homered to left center (388 feet), Koss scored, Lee scored and Schmitt scored. |
 |
10th Inning | Schmitt intentionally walked, Lee to second. |
 |
10th Inning | Lee walked. |
 |
10th Inning | Scott relieved Treinen |
 |
10th Inning | Chapman grounded out to second, Koss to third. |
 |
10th Inning | Koss ran for Flores |
Statistics
 LAD LAD |
 SF SF |
|
|---|---|---|
| 1 | Games Played | 1 |
| 1 | Team Games Played | 1 |
| 1 | Hit By Pitch | 0 |
| 9 | Ground Balls | 8 |
| 5 | Strikeouts | 13 |
| 1 | Runs Batted In | 4 |
| 0 | Sacrifice Hit | 0 |
| 4 | Hits | 3 |
| 0 | Stolen Bases | 0 |
| 5 | Walks | 4 |
| 0 | Catcher Interference | 0 |
| 1 | Runs | 5 |
| 0 | Ground Into Double Play | 0 |
| 0 | Sacrifice Flies | 0 |
| 33 | At Bats | 31 |
| 1 | Home Runs | 1 |
| 0 | Grand Slam Home Runs | 1 |
| 17 | Runners Left On Base | 7 |
| 0 | Triples | 0 |
| 0 | Game Winning RBIs | 1 |
| 2 | Intentional Walks | 2 |
| 1 | Doubles | 1 |
| 19 | Fly Balls | 10 |
| 0 | Caught Stealing | 0 |
| 139 | Pitches | 126 |
| 0 | Games Started | 0 |
| 0 | Pinch At Bats | 2 |
| 0 | Pinch Hits | 0 |
| 0.0 | Player Rating | 0.0 |
| 1 | Is Qualified | 1 |
| 0 | Is Qualified In Steals | 0 |
| 8 | Total Bases | 7 |
| 39 | Plate Appearances | 35 |
| 162.0 | Projected Home Runs | 162.0 |
| 2 | Extra Base Hits | 2 |
| 2.2 | Runs Created | 1.0 |
| .121 | Batting Average | .097 |
| .000 | Pinch Hit Average | .000 |
| .242 | Slugging Percentage | .226 |
| .273 | Secondary Average | .258 |
| .256 | On Base Percentage | .200 |
| .499 | OBP Pct + SLG Pct | .426 |
| 0.5 | Ground To Fly Ball Ratio | 0.8 |
| 2.1 | Runs Created Per 27 Outs | 1.0 |
| 13.0 | Batter Rating | 26.0 |
| 33.0 | At Bats Per Home Run | 31.0 |
| 0.00 | Stolen Base Percentage | 0.00 |
| 3.56 | Pitches Per Plate Appearance | 3.60 |
| .121 | Isolated Power | .129 |
| 1.00 | Walk To Strikeout Ratio | 0.31 |
| .128 | Walks Per Plate Appearance | .114 |
| .152 | Secondary Average Minus Batting Average | .161 |
| 2.0 | Runs Produced | 9.0 |
| 1.0 | Runs Ratio | 0.8 |
| 0.4 | Patience Ratio | 0.3 |
| 0.1 | Balls In Play Average | 0.1 |
| 66.0 | MLB Rating | 68.8 |
| 0.0 | Offensive Wins Above Replacement | 0.0 |
| 0.0 | Wins Above Replacement | 0.0 |
Game Information

Location: San Francisco, California
Attendance: 40,509 | Capacity: