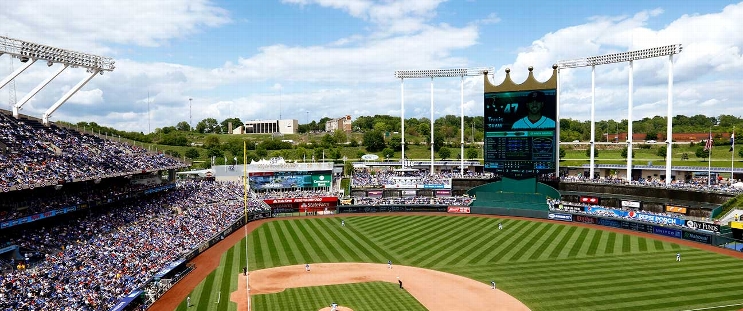
Seattle Mariners at Kansas City Royals
· Major League Baseball
2 - 0

Mariners' rare challenge helps secure 2-0 win over Royals, tie Astros for first place in AL West

The Mariners are headed to Houston for a three-game series beginning Friday night.
Eduard Bazardo and Gabe Speier tossed an inning apiece for Seattle. Andres Muñoz stranded two in the ninth by striking out Adam Frazier on three pitches for his 36th save.
Castillo (10-8) dueled with Kansas City counterpart Stephen Kolek, who allowed two runs — one earned — while pitching into the eighth inning. One run came on Polanco's double and the other after an astute move by manager Dan Wilson in the eighth.
Kolek appeared to have retired the first two batters of the inning when Wilson challenged that second baseman Michael Massey set up on the grass ahead of Dominic Canzone's groundout, in violation of Major League Baseball's defensive shift rules. The challenge was successful, Canzone was awarded first base, and reliever Daniel Lynch IV eventually gave up Crawford's run-scoring double to make it 2-0.
Castillo and Kolek (5-6) were so stingy that each allowed just a pair of runners over the first four innings, and both times they were on back-to-back hits. The difference was the Royals paired together singles and stranded both runners while the Mariners got Josh Naylor's single and an RBI double by Polanco for a 1-0 lead.
Castillo only allowed one other runner, a single by Royals rookie Carter Jensen in the fifth. Kolek similarly breezed through the Seattle lineup until a two-out walk to Naylor in the seventh; he promptly struck out Polanco to end the inning.
How can I watch Seattle Mariners vs. Kansas City Royals?
- TV Channel: Mariners at Royals 2022 MLB Baseball, is broadcasted on MLB.TV.
- Online streaming: Sign up for Fubo.
Scoring Summary
 |
9th Inning | Frazier struck out swinging. |
 |
9th Inning | Rave ran for Perez |
 |
9th Inning | Perez hit by pitch. |
 |
9th Inning | Garcia struck out swinging. |
 |
9th Inning | Pasquantino doubled to right. |
 |
9th Inning | Witt Jr. struck out swinging. |
Statistics
 SEA SEA |
 KC KC |
|
|---|---|---|
| 1 | Games Played | 1 |
| 1 | Team Games Played | 1 |
| 0 | Hit By Pitch | 1 |
| 14 | Ground Balls | 5 |
| 8 | Strikeouts | 8 |
| 2 | Runs Batted In | 0 |
| 0 | Sacrifice Hit | 0 |
| 5 | Hits | 5 |
| 0 | Stolen Bases | 0 |
| 1 | Walks | 0 |
| 0 | Catcher Interference | 0 |
| 2 | Runs | 0 |
| 1 | Ground Into Double Play | 0 |
| 0 | Sacrifice Flies | 0 |
| 30 | At Bats | 32 |
| 0 | Home Runs | 0 |
| 0 | Grand Slam Home Runs | 0 |
| 7 | Runners Left On Base | 11 |
| 0 | Triples | 0 |
| 1 | Game Winning RBIs | 0 |
| 0 | Intentional Walks | 0 |
| 2 | Doubles | 1 |
| 9 | Fly Balls | 19 |
| 0 | Caught Stealing | 0 |
| 122 | Pitches | 120 |
| 0 | Games Started | 0 |
| 0 | Pinch At Bats | 3 |
| 0 | Pinch Hits | 0 |
| 0.0 | Player Rating | 0.0 |
| 1 | Is Qualified | 1 |
| 0 | Is Qualified In Steals | 0 |
| 7 | Total Bases | 6 |
| 31 | Plate Appearances | 33 |
| 0.0 | Projected Home Runs | 0.0 |
| 2 | Extra Base Hits | 1 |
| 0.6 | Runs Created | 0.4 |
| .167 | Batting Average | .156 |
| .000 | Pinch Hit Average | .000 |
| .233 | Slugging Percentage | .188 |
| .100 | Secondary Average | .031 |
| .194 | On Base Percentage | .182 |
| .427 | OBP Pct + SLG Pct | .369 |
| 1.6 | Ground To Fly Ball Ratio | 0.3 |
| 0.6 | Runs Created Per 27 Outs | 0.4 |
| 17.0 | Batter Rating | 7.0 |
| 0.0 | At Bats Per Home Run | 0.0 |
| 0.00 | Stolen Base Percentage | 0.00 |
| 3.94 | Pitches Per Plate Appearance | 3.64 |
| .067 | Isolated Power | .031 |
| 0.13 | Walk To Strikeout Ratio | 0.00 |
| .032 | Walks Per Plate Appearance | .000 |
| -.067 | Secondary Average Minus Batting Average | -.125 |
| 4.0 | Runs Produced | 0.0 |
| 1.0 | Runs Ratio | 0.0 |
| 0.3 | Patience Ratio | 0.2 |
| 0.2 | Balls In Play Average | 0.2 |
| 67.0 | MLB Rating | 61.5 |
| 0.0 | Offensive Wins Above Replacement | 0.0 |
| 0.0 | Wins Above Replacement | 0.0 |
Game Information

Location: Kansas City, Missouri
Attendance: 18,137 | Capacity: