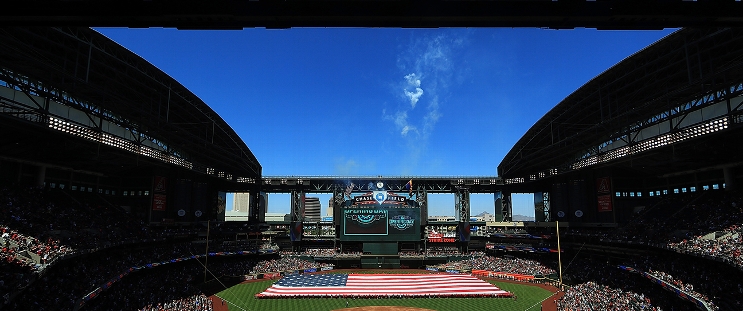
Philadelphia Phillies at Arizona Diamondbacks
· Major League Baseball
2 - 9

Corbin Carroll has 4 RBIs and Diamondbacks close in on NL wild card with 9-2 win over Phillies

Carroll drove in a run in the first inning against Ranger Suárez (12-7) and hit a three-run homer in the second. He also stole second in the sixth to become the first Arizona player with 30 homers (31) and 30 stolen bases (30) in a season.
Rodriguez (9-8) scattered six hits and struck out five with three walks. Jorge Barrosa hit his first big league homer and Tim Tawa added another solo shot.
The Diamondbacks have won six of eight to enter the final week of the regular season in the thick of the wild-card race. Cincinnati beat the Chicago Cubs on Sunday and moved into a tie with the struggling New York Mets for the last NL playoff berth.
Alec Bohm went 4 for 4 for the NL East champion Phillies.
Suárez had been sharp over his previous five starts, allowing four earned runs in 30 innings.
The Diamondbacks scored more than that against the left-hander in the second. Ketel Marte hit a two-run single and Carroll followed with a three-run homer to put Arizona up 6-0.
Suárez allowed six runs on eight hits with two strikeouts and a walk in four innings.
How can I watch Philadelphia Phillies vs. Arizona Diamondbacks?
- TV Channel: Phillies at Diamondbacks 2022 MLB Baseball, is broadcasted on MLB.TV.
- Online streaming: Sign up for Fubo.
Scoring Summary
 |
9th Inning | Castellanos struck out swinging. |
 |
9th Inning | Bohm singled to left, Harper to second. |
 |
9th Inning | Realmuto struck out swinging. |
 |
9th Inning | Harper singled to left. |
 |
9th Inning | Schwarber popped out to third. |
 |
9th Inning | Crismatt relieved Rashi |
Statistics
 PHI PHI |
 ARI ARI |
|
|---|---|---|
| 1 | Games Played | 1 |
| 1 | Team Games Played | 1 |
| 0 | Hit By Pitch | 1 |
| 7 | Ground Balls | 21 |
| 8 | Strikeouts | 5 |
| 2 | Runs Batted In | 9 |
| 0 | Sacrifice Hit | 0 |
| 11 | Hits | 15 |
| 0 | Stolen Bases | 1 |
| 5 | Walks | 1 |
| 0 | Catcher Interference | 0 |
| 2 | Runs | 9 |
| 1 | Ground Into Double Play | 0 |
| 0 | Sacrifice Flies | 0 |
| 37 | At Bats | 39 |
| 0 | Home Runs | 3 |
| 0 | Grand Slam Home Runs | 0 |
| 28 | Runners Left On Base | 18 |
| 0 | Triples | 0 |
| 0 | Game Winning RBIs | 1 |
| 0 | Intentional Walks | 0 |
| 3 | Doubles | 2 |
| 22 | Fly Balls | 13 |
| 0 | Caught Stealing | 0 |
| 144 | Pitches | 165 |
| 0 | Games Started | 0 |
| 0 | Pinch At Bats | 0 |
| 0 | Pinch Hits | 0 |
| 0.0 | Player Rating | 0.0 |
| 1 | Is Qualified | 1 |
| 0 | Is Qualified In Steals | 1 |
| 14 | Total Bases | 26 |
| 42 | Plate Appearances | 41 |
| 0.0 | Projected Home Runs | 486.0 |
| 3 | Extra Base Hits | 5 |
| 5.4 | Runs Created | 10.0 |
| .297 | Batting Average | .385 |
| .000 | Pinch Hit Average | .000 |
| .378 | Slugging Percentage | .667 |
| .216 | Secondary Average | .333 |
| .381 | On Base Percentage | .415 |
| .759 | OBP Pct + SLG Pct | 1.081 |
| 0.3 | Ground To Fly Ball Ratio | 1.6 |
| 5.4 | Runs Created Per 27 Outs | 11.3 |
| 25.0 | Batter Rating | 65.0 |
| 0.0 | At Bats Per Home Run | 13.0 |
| 0.00 | Stolen Base Percentage | 1.00 |
| 3.43 | Pitches Per Plate Appearance | 4.02 |
| .081 | Isolated Power | .282 |
| 0.63 | Walk To Strikeout Ratio | 0.20 |
| .119 | Walks Per Plate Appearance | .024 |
| -.081 | Secondary Average Minus Batting Average | -.051 |
| 4.0 | Runs Produced | 18.0 |
| 1.0 | Runs Ratio | 1.0 |
| 0.5 | Patience Ratio | 0.7 |
| 0.4 | Balls In Play Average | 0.4 |
| 80.8 | MLB Rating | 111.5 |
| 0.0 | Offensive Wins Above Replacement | 0.0 |
| 0.0 | Wins Above Replacement | 0.0 |
Game Information

Location: Phoenix, Arizona
Attendance: 37,105 | Capacity: