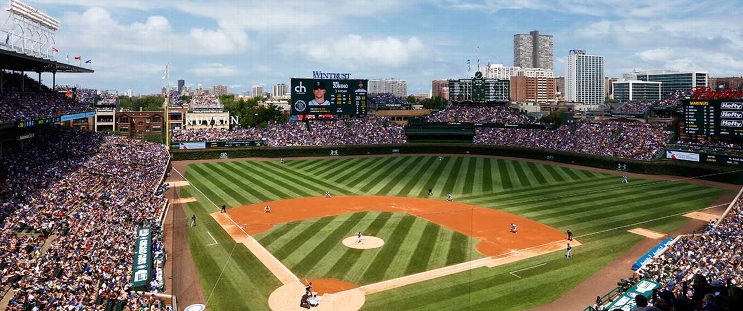
New York Mets at Chicago Cubs
· Major League Baseball
3 - 10

Matt Shaw and Michael Busch homer as Cubs rout Mets 10-3

Matthew Boyd (14-8) tossed two-hit ball over 5 1/3 innings to help playoff-bound Chicago solidify its hold on the first National League wild card, 2 1/2 games ahead of San Diego. The Cubs have four games left, while the Padres have three.
Juan Soto hit his 43rd homer and Francisco Alvarez launched a two-run drive, but the Mets were held to four hits. New York got help elsewhere when Arizona and Cincinnati lost in extra innings, keeping the Mets one game ahead of both in a scramble for the final NL wild card.
Boyd retired 12 of the first 13 Mets batters and didn’t allow a hit until Mark Vientos singled leading off the fifth. Daniel Palencia, who returned Wednesday from the injured list, followed Boyd and got the final two outs of the sixth.
Aaron Civale pitched three innings for his first career save.
The Cubs took control with a five-run rally in the third off rookie Jonah Tong (2-3). The 22-year-old right-hander, making his fifth start in the majors, was charged with five runs on seven hits and two walks in two-plus innings.
Shaw homered leading off the fourth.
Alvarez connected in the fifth to cut it to 6-2. The Cubs replied with two unearned runs in the bottom half, then Busch hit a two-run drive in the sixth for his 31st homer of the season.
How can I watch New York Mets vs. Chicago Cubs?
- TV Channel: Mets at Cubs 2022 MLB Baseball, is broadcasted on ESPN.
- Online streaming: Sign up for Fubo.
Scoring Summary
 |
9th Inning | Nimmo grounded out to third. |
 |
9th Inning | Vientos grounded out to second. |
 |
9th Inning | Marte grounded out to third. |
 |
8th Inning | Hoerner grounded into fielder's choice to shortstop, Swanson out at second. |
 |
8th Inning | Busch flied out to left. |
 |
8th Inning | Shaw struck out looking. |
Statistics
 NYM NYM |
 CHC CHC |
|
|---|---|---|
| 1 | Games Played | 1 |
| 1 | Team Games Played | 1 |
| 1 | Hit By Pitch | 0 |
| 9 | Ground Balls | 15 |
| 7 | Strikeouts | 6 |
| 3 | Runs Batted In | 8 |
| 0 | Sacrifice Hit | 0 |
| 4 | Hits | 11 |
| 0 | Stolen Bases | 1 |
| 1 | Walks | 3 |
| 0 | Catcher Interference | 0 |
| 3 | Runs | 10 |
| 0 | Ground Into Double Play | 0 |
| 0 | Sacrifice Flies | 1 |
| 31 | At Bats | 34 |
| 2 | Home Runs | 2 |
| 0 | Grand Slam Home Runs | 0 |
| 8 | Runners Left On Base | 12 |
| 0 | Triples | 0 |
| 0 | Game Winning RBIs | 1 |
| 0 | Intentional Walks | 0 |
| 0 | Doubles | 3 |
| 15 | Fly Balls | 14 |
| 0 | Caught Stealing | 0 |
| 136 | Pitches | 141 |
| 0 | Games Started | 0 |
| 0 | Pinch At Bats | 0 |
| 0 | Pinch Hits | 0 |
| 0.0 | Player Rating | 0.0 |
| 1 | Is Qualified | 1 |
| 0 | Is Qualified In Steals | 1 |
| 10 | Total Bases | 20 |
| 33 | Plate Appearances | 38 |
| 324.0 | Projected Home Runs | 324.0 |
| 2 | Extra Base Hits | 5 |
| 1.7 | Runs Created | 7.6 |
| .129 | Batting Average | .324 |
| .000 | Pinch Hit Average | .000 |
| .323 | Slugging Percentage | .588 |
| .226 | Secondary Average | .382 |
| .182 | On Base Percentage | .368 |
| .504 | OBP Pct + SLG Pct | .957 |
| 0.6 | Ground To Fly Ball Ratio | 1.1 |
| 1.7 | Runs Created Per 27 Outs | 8.5 |
| 22.0 | Batter Rating | 60.0 |
| 15.5 | At Bats Per Home Run | 17.0 |
| 0.00 | Stolen Base Percentage | 1.00 |
| 4.12 | Pitches Per Plate Appearance | 3.71 |
| .194 | Isolated Power | .265 |
| 0.14 | Walk To Strikeout Ratio | 0.50 |
| .030 | Walks Per Plate Appearance | .079 |
| .097 | Secondary Average Minus Batting Average | .059 |
| 6.0 | Runs Produced | 18.0 |
| 1.0 | Runs Ratio | 0.8 |
| 0.4 | Patience Ratio | 0.6 |
| 0.1 | Balls In Play Average | 0.3 |
| 71.0 | MLB Rating | 102.0 |
| 0.0 | Offensive Wins Above Replacement | 0.0 |
| 0.0 | Wins Above Replacement | 0.0 |
Game Information

Location: Chicago, Illinois
Attendance: 35,060 | Capacity:
2025 National League East Standings
| TEAM | W | L | PCT | GB | STRK |
|---|---|---|---|---|---|
 Philadelphia Philadelphia |
96 | 66 | .593 | - | W1 |
 New York New York |
83 | 79 | .512 | 13 | L1 |
 Miami Miami |
79 | 83 | .488 | 17 | W1 |
 Atlanta Atlanta |
76 | 86 | .469 | 20 | W1 |
 Washington Washington |
66 | 96 | .407 | 30 | L1 |
2025 National League Central Standings
| TEAM | W | L | PCT | GB | STRK |
|---|---|---|---|---|---|
 Milwaukee Milwaukee |
97 | 65 | .599 | - | W1 |
 Chicago Chicago |
92 | 70 | .568 | 5 | W3 |
 Cincinnati Cincinnati |
83 | 79 | .512 | 14 | L1 |
 St. Louis St. Louis |
78 | 84 | .481 | 19 | L4 |
 Pittsburgh Pittsburgh |
71 | 91 | .438 | 26 | L1 |