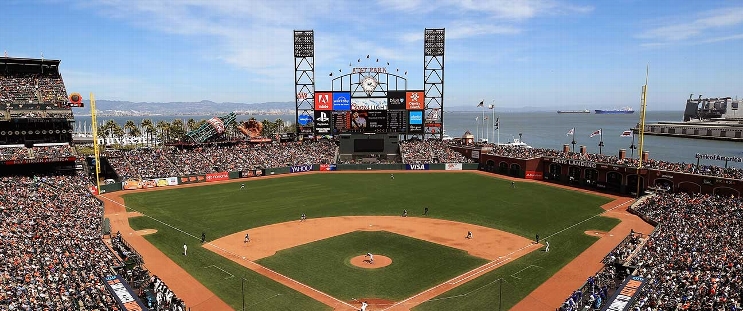
St. Louis Cardinals at San Francisco Giants
· Major League Baseball
3 - 4

Cardinals eliminated from playoff contention following 4-3 loss to Giants

Rafael Devers hit his 34th home run of the season, and Casey Schmitt had three hits to help the San Francisco avoid the series sweep.
One day after the Cardinals ended the Giants’ postseason hopes with a late comeback, manager Bob Melvin’s club returned the favor with a late rally of its own.
Christian Koss led off the eighth with a soft single over the outstretched glove of first baseman Nolan Arenado. Knizner, who had a sacrifice fly in the fifth, followed with a sharp liner off Riley O’Brien (3-1) that skipped past Cardinals diving center fielder Victor Scott and rolled to the wall as Koss raced around the bases.
Jose Butto (5-3), the third of four relievers used by Melvin, retired two batters to get the win, and Tristian Beck worked the ninth for his second save.
San Francisco did the majority of its scoring off St. Louis starter Sonny Gray. Gray had seven strikeouts in six innings, allowing three runs (two earned) and seven hits.
The Giants led 3-2 until Arenado tied it with a sacrifice fly in the eighth.
Giants starter JT Brubaker allowed two runs and four hits over four innings of his first start in the majors since 2022.
Giants rookie RHP Trevor McDonald pitches against the Colorado Rockies on Friday.
How can I watch St. Louis Cardinals vs. San Francisco Giants?
- TV Channel: Cardinals at Giants 2022 MLB Baseball, is broadcasted on MLB.TV.
- Online streaming: Sign up for Fubo.
Scoring Summary
 |
9th Inning | Fermín bunt grounded out to third. |
 |
9th Inning | Fermín hit for Scott II |
 |
9th Inning | Walker grounded into double play, second to first, Church out at second. |
 |
9th Inning | Church ran for Pagés |
 |
9th Inning | Pagés singled to center. |
 |
9th Inning | Beck relieved Buttó |
Statistics
 STL STL |
 SF SF |
|
|---|---|---|
| 1 | Games Played | 1 |
| 1 | Team Games Played | 1 |
| 0 | Hit By Pitch | 0 |
| 14 | Ground Balls | 15 |
| 10 | Strikeouts | 9 |
| 3 | Runs Batted In | 3 |
| 0 | Sacrifice Hit | 0 |
| 7 | Hits | 11 |
| 0 | Stolen Bases | 0 |
| 3 | Walks | 3 |
| 0 | Catcher Interference | 0 |
| 3 | Runs | 4 |
| 1 | Ground Into Double Play | 0 |
| 1 | Sacrifice Flies | 1 |
| 32 | At Bats | 35 |
| 0 | Home Runs | 1 |
| 0 | Grand Slam Home Runs | 0 |
| 9 | Runners Left On Base | 18 |
| 0 | Triples | 1 |
| 0 | Game Winning RBIs | 1 |
| 0 | Intentional Walks | 1 |
| 2 | Doubles | 3 |
| 9 | Fly Balls | 12 |
| 0 | Caught Stealing | 1 |
| 146 | Pitches | 128 |
| 0 | Games Started | 0 |
| 1 | Pinch At Bats | 0 |
| 0 | Pinch Hits | 0 |
| 0.0 | Player Rating | 0.0 |
| 1 | Is Qualified | 1 |
| 0 | Is Qualified In Steals | 1 |
| 9 | Total Bases | 19 |
| 36 | Plate Appearances | 39 |
| 0.0 | Projected Home Runs | 162.0 |
| 2 | Extra Base Hits | 5 |
| 2.3 | Runs Created | 6.5 |
| .219 | Batting Average | .314 |
| .000 | Pinch Hit Average | .000 |
| .281 | Slugging Percentage | .543 |
| .156 | Secondary Average | .286 |
| .278 | On Base Percentage | .359 |
| .559 | OBP Pct + SLG Pct | .902 |
| 1.6 | Ground To Fly Ball Ratio | 1.3 |
| 2.3 | Runs Created Per 27 Outs | 6.8 |
| 23.0 | Batter Rating | 36.5 |
| 0.0 | At Bats Per Home Run | 35.0 |
| 0.00 | Stolen Base Percentage | 0.00 |
| 4.06 | Pitches Per Plate Appearance | 3.28 |
| .063 | Isolated Power | .229 |
| 0.30 | Walk To Strikeout Ratio | 0.33 |
| .083 | Walks Per Plate Appearance | .077 |
| -.063 | Secondary Average Minus Batting Average | -.029 |
| 6.0 | Runs Produced | 7.0 |
| 1.0 | Runs Ratio | 0.8 |
| 0.3 | Patience Ratio | 0.6 |
| 0.3 | Balls In Play Average | 0.4 |
| 73.3 | MLB Rating | 88.5 |
| 0.0 | Offensive Wins Above Replacement | 0.0 |
| 0.0 | Wins Above Replacement | 0.0 |
Game Information

Location: San Francisco, California
Attendance: 32,409 | Capacity:
2025 National League Central Standings
| TEAM | W | L | PCT | GB | STRK |
|---|---|---|---|---|---|
 Milwaukee Milwaukee |
97 | 65 | .599 | - | W1 |
 Chicago Chicago |
92 | 70 | .568 | 5 | W3 |
 Cincinnati Cincinnati |
83 | 79 | .512 | 14 | L1 |
 St. Louis St. Louis |
78 | 84 | .481 | 19 | L4 |
 Pittsburgh Pittsburgh |
71 | 91 | .438 | 26 | L1 |
2025 National League West Standings
| TEAM | W | L | PCT | GB | STRK |
|---|---|---|---|---|---|
 Los Angeles Los Angeles |
93 | 69 | .574 | - | W5 |
 San Diego San Diego |
90 | 72 | .556 | 3 | W3 |
 San Francisco San Francisco |
81 | 81 | .500 | 12 | W4 |
 Arizona Arizona |
80 | 82 | .494 | 13 | L5 |
 Colorado Colorado |
43 | 119 | .265 | 50 | L6 |