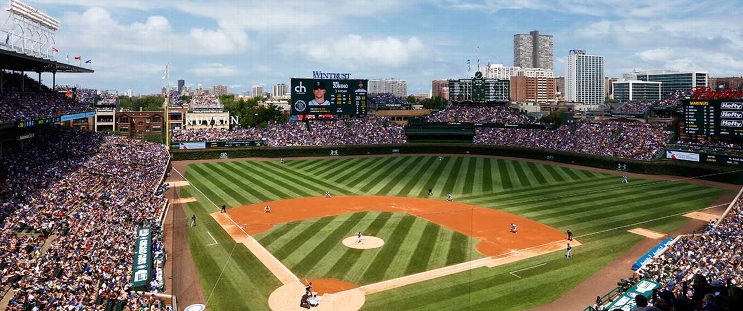
New York Mets at Chicago Cubs
· Major League Baseball
8 - 5

Lindor homers to join 30-30 club as Mets beat Cubs 8-5 to remain in playoff position

The Mets built a six-run lead and withstood a shaky outing by rookie Nolan McLean (5-1). They remained a game ahead of Cincinnati in the playoff race, with the Reds beating Pittsburgh 2-1.
Chicago’s Shota Imanaga (9-8) got tagged for a season-high eight runs in 5 2/3 innings. Seiya Suzuki homered twice and Dansby Swanson also connected for the Cubs, who have lost six of seven.
Chicago leads San Diego by two games with three to play for the top wild card and home-field advantage in the opening round of the playoffs. Those two teams will meet in Game 1 on Tuesday.
The Mets led 2-0 in the third when Lindor connected against Imanaga, sending a solo drive beyond the left-field bleachers to Waveland Avenue. That gave him 30 homers to go with 31 steals. The five-time All-Star had 31 homers and 31 steals for New York in 2023.
Though he struck out a personal-best 11, McLean gave up a season-high five runs and five hits in 5 1/3 innings. Edwin Díaz worked the ninth for his 28th save in 31 chances.
Suzuki hit a solo shot in the fourth and chased McLean with a three-run drive in the sixth.
Cubs: Had not announced a starter for Friday's game against St. Louis and RHP Miles Mikolas (8-10, 4.76).
How can I watch New York Mets vs. Chicago Cubs?
- TV Channel: Mets at Cubs 2022 MLB Baseball, is broadcasted on MLB Net.
- Online streaming: Sign up for Fubo.
Scoring Summary
 |
9th Inning | Swanson grounded into double play, shortstop to second to first, Kelly out at second. |
 |
9th Inning | Crow-Armstrong flied out to right. |
 |
9th Inning | Kelly singled to left. |
 |
9th Inning | Díaz relieved Rogers |
 |
9th Inning | J. Soto struck out swinging. |
 |
9th Inning | Lindor flied out to center. |
Statistics
 NYM NYM |
 CHC CHC |
|
|---|---|---|
| 1 | Games Played | 1 |
| 1 | Team Games Played | 1 |
| 0 | Hit By Pitch | 0 |
| 0 | Ground Balls | 0 |
| 7 | Strikeouts | 14 |
| 8 | Runs Batted In | 5 |
| 0 | Sacrifice Hit | 0 |
| 10 | Hits | 7 |
| 0 | Stolen Bases | 0 |
| 2 | Walks | 2 |
| 0 | Catcher Interference | 0 |
| 8 | Runs | 5 |
| 0 | Ground Into Double Play | 1 |
| 0 | Sacrifice Flies | 0 |
| 36 | At Bats | 33 |
| 2 | Home Runs | 3 |
| 0 | Grand Slam Home Runs | 0 |
| 8 | Runners Left On Base | 7 |
| 0 | Triples | 0 |
| 0 | Game Winning RBIs | 0 |
| 0 | Intentional Walks | 0 |
| 2 | Doubles | 2 |
| 0 | Fly Balls | 0 |
| 0 | Caught Stealing | 0 |
| 137 | Pitches | 143 |
| 0 | Games Started | 0 |
| 0 | Pinch At Bats | 0 |
| 0 | Pinch Hits | 0 |
| 0.0 | Player Rating | 0.0 |
| 1 | Is Qualified | 1 |
| 0 | Is Qualified In Steals | 0 |
| 18 | Total Bases | 18 |
| 38 | Plate Appearances | 35 |
| 324.0 | Projected Home Runs | 486.0 |
| 4 | Extra Base Hits | 5 |
| 5.7 | Runs Created | 4.5 |
| .278 | Batting Average | .212 |
| .000 | Pinch Hit Average | .000 |
| .500 | Slugging Percentage | .545 |
| .278 | Secondary Average | .394 |
| .316 | On Base Percentage | .257 |
| .816 | OBP Pct + SLG Pct | .803 |
| 0.0 | Ground To Fly Ball Ratio | 0.0 |
| 5.9 | Runs Created Per 27 Outs | 4.5 |
| 52.0 | Batter Rating | 40.0 |
| 18.0 | At Bats Per Home Run | 11.0 |
| 0.00 | Stolen Base Percentage | 0.00 |
| 3.61 | Pitches Per Plate Appearance | 4.09 |
| .222 | Isolated Power | .333 |
| 0.29 | Walk To Strikeout Ratio | 0.14 |
| .053 | Walks Per Plate Appearance | .057 |
| .000 | Secondary Average Minus Batting Average | .182 |
| 16.0 | Runs Produced | 10.0 |
| 1.0 | Runs Ratio | 1.0 |
| 0.5 | Patience Ratio | 0.6 |
| 0.3 | Balls In Play Average | 0.3 |
| 95.3 | MLB Rating | 84.5 |
| 0.0 | Offensive Wins Above Replacement | 0.0 |
| 0.0 | Wins Above Replacement | 0.0 |
Game Information

Location: Chicago, Illinois
Attendance: 38,465 | Capacity:
2025 National League East Standings
| TEAM | W | L | PCT | GB | STRK |
|---|---|---|---|---|---|
 Philadelphia Philadelphia |
96 | 66 | .593 | - | W1 |
 New York New York |
83 | 79 | .512 | 13 | L1 |
 Miami Miami |
79 | 83 | .488 | 17 | W1 |
 Atlanta Atlanta |
76 | 86 | .469 | 20 | W1 |
 Washington Washington |
66 | 96 | .407 | 30 | L1 |
2025 National League Central Standings
| TEAM | W | L | PCT | GB | STRK |
|---|---|---|---|---|---|
 Milwaukee Milwaukee |
97 | 65 | .599 | - | W1 |
 Chicago Chicago |
92 | 70 | .568 | 5 | W3 |
 Cincinnati Cincinnati |
83 | 79 | .512 | 14 | L1 |
 St. Louis St. Louis |
78 | 84 | .481 | 19 | L4 |
 Pittsburgh Pittsburgh |
71 | 91 | .438 | 26 | L1 |