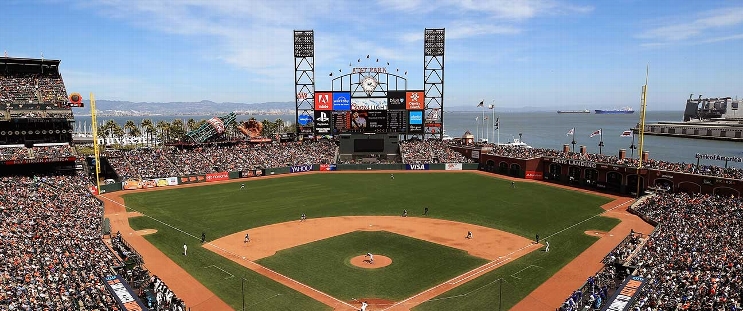
Colorado Rockies at San Francisco Giants
· Major League Baseball
3 - 4

Justin Verlander earns a win in final start of year as Giants hold off Rockies 4-3

Casey Schmitt hit a go-ahead three-run homer in the second inning to support Verlander (4-11), who received 62 total runs of support in his 29 starts.
T he 42-year-old right-hander signed a $15 million, one-year contract in January and wrapped up his 20th major league season with career start No. 555 — which ranks 27th all-time. He also tied Bob Feller and Eppa Rixey for 34th place on baseball’s career win list with 266.
Rafael Devers added a key RBI double in the eighth for insurance before Colorado's Jordan Beck homered in the ninth off Ryan Walker. Walker then surrendered Brenton Doyle's double and was done after walking Kyle Karros one out later.
Spencer Bivens entered and struck out Warming Bernabel, then plunked Ryan Ritter to load the bases. Third baseman Matt Chapman then made a tough catch in foul territory on Ezequiel Tovar's popup to end it as Bivens earned his second save.
Hunter Goodman homered in the first before Doyle connected the next inning for Colorado, which lost its fifth straight.
After Schmitt's home run, Kyle Freeland retired the next 12 San Francisco hitters in order until Heliot Ramos singled to start the sixth.
Freeland (5-17) was tagged for three runs on three hits in six innings.
The Rockies' 118th defeat is the most in NL since the 1962 Mets lost 120.
How can I watch Colorado Rockies vs. San Francisco Giants?
- TV Channel: Rockies at Giants 2022 MLB Baseball, is broadcasted on MLB.TV.
- Online streaming: Sign up for Fubo.
Scoring Summary
 |
9th Inning | Tovar fouled out to third. |
 |
9th Inning | Ritter hit by pitch, Karros to second. |
 |
9th Inning | Bernabel struck out swinging. |
 |
9th Inning | Bivens relieved Walker |
 |
9th Inning | Karros walked. |
 |
9th Inning | Fernández grounded out to second, Doyle to third. |
Statistics
 COL COL |
 SF SF |
|
|---|---|---|
| 1 | Games Played | 1 |
| 1 | Team Games Played | 1 |
| 1 | Hit By Pitch | 0 |
| 10 | Ground Balls | 8 |
| 8 | Strikeouts | 7 |
| 3 | Runs Batted In | 4 |
| 0 | Sacrifice Hit | 0 |
| 7 | Hits | 4 |
| 0 | Stolen Bases | 0 |
| 3 | Walks | 2 |
| 0 | Catcher Interference | 0 |
| 3 | Runs | 4 |
| 1 | Ground Into Double Play | 0 |
| 0 | Sacrifice Flies | 0 |
| 33 | At Bats | 28 |
| 3 | Home Runs | 1 |
| 0 | Grand Slam Home Runs | 0 |
| 12 | Runners Left On Base | 5 |
| 1 | Triples | 0 |
| 0 | Game Winning RBIs | 1 |
| 0 | Intentional Walks | 0 |
| 1 | Doubles | 1 |
| 15 | Fly Balls | 13 |
| 0 | Caught Stealing | 0 |
| 138 | Pitches | 126 |
| 0 | Games Started | 0 |
| 0 | Pinch At Bats | 1 |
| 0 | Pinch Hits | 0 |
| 0.0 | Player Rating | 0.0 |
| 1 | Is Qualified | 1 |
| 0 | Is Qualified In Steals | 0 |
| 19 | Total Bases | 8 |
| 37 | Plate Appearances | 30 |
| 486.0 | Projected Home Runs | 162.0 |
| 5 | Extra Base Hits | 2 |
| 5.5 | Runs Created | 1.4 |
| .212 | Batting Average | .143 |
| .000 | Pinch Hit Average | .000 |
| .576 | Slugging Percentage | .286 |
| .455 | Secondary Average | .214 |
| .297 | On Base Percentage | .200 |
| .873 | OBP Pct + SLG Pct | .486 |
| 0.7 | Ground To Fly Ball Ratio | 0.6 |
| 5.5 | Runs Created Per 27 Outs | 1.6 |
| 32.5 | Batter Rating | 25.0 |
| 11.0 | At Bats Per Home Run | 28.0 |
| 0.00 | Stolen Base Percentage | 0.00 |
| 3.73 | Pitches Per Plate Appearance | 4.20 |
| .364 | Isolated Power | .143 |
| 0.38 | Walk To Strikeout Ratio | 0.29 |
| .081 | Walks Per Plate Appearance | .067 |
| .242 | Secondary Average Minus Batting Average | .071 |
| 6.0 | Runs Produced | 8.0 |
| 1.0 | Runs Ratio | 1.0 |
| 0.7 | Patience Ratio | 0.3 |
| 0.2 | Balls In Play Average | 0.2 |
| 83.5 | MLB Rating | 71.8 |
| 0.0 | Offensive Wins Above Replacement | 0.0 |
| 0.0 | Wins Above Replacement | 0.0 |
Game Information

Location: San Francisco, California
Attendance: 38,201 | Capacity: