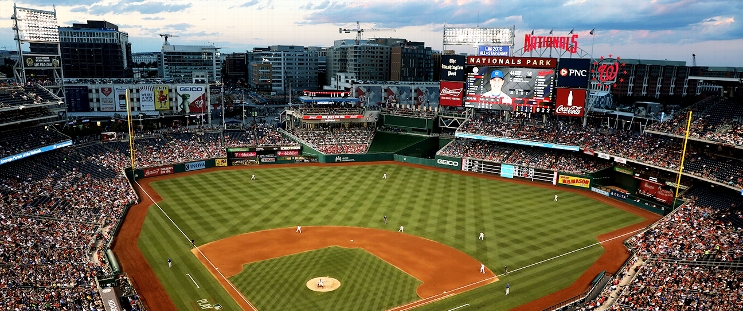
Chicago White Sox at Washington Nationals
· Major League Baseball
8 - 0

Shane Smith give up one hit in six innings as White Sox rout Nationals, 8-0

Miguel Vargas and Dominic Fletcher also homered for the White Sox, who concluded their first season under Will Venable at 60-102. It was a 19-game improvement after the franchise went 41-121 in 2024 to set the modern record for single-season losses.
Washington closed at 66-96, a decline of five games after going 71-91 the last two seasons.
The Nationals finished last in the NL East for the fifth time in six years. Interim manager Miguel Cairo was 29-43 after taking over for Dave Martinez, who was fired July 6 with Washington at 37-53.
Smith (7-8) retired the first 16 batters he faced before Brady House singled. The right-hander struck out eight in six innings.
Vargas hit a two-run homer off Washington starter Brad Lord (5-10) in the first inning. Baldwin hit a solo shot and Fletcher had a two-run homer in the fourth.
Lord allowed five runs in four innings.
Baldwin added a two-run double off Shinnosuke Ogasawara in the fifth.
Former National Michael A. Taylor, who announced his retirement before the game, received applause before each plate appearance and had an RBI groundout in the eighth in his final at-bat.
Washington’s season attendance of 1,916,768 was a 1% decrease from last year’s total.
How can I watch Chicago White Sox vs. Washington Nationals?
- TV Channel: White Sox at Nationals 2022 MLB Baseball, is broadcasted on MLB.TV.
- Online streaming: Sign up for Fubo.
Scoring Summary
 |
9th Inning | Nuñez struck out looking. |
 |
9th Inning | Nuñez hit for Wood |
 |
9th Inning | Hassell III struck out looking. |
 |
9th Inning | Hill in center field. |
 |
9th Inning | Hassell III hit for Young |
 |
9th Inning | House flied out to left. |
Statistics
 CHW CHW |
 WSH WSH |
|
|---|---|---|
| 1 | Games Played | 1 |
| 1 | Team Games Played | 1 |
| 0 | Hit By Pitch | 0 |
| 14 | Ground Balls | 6 |
| 8 | Strikeouts | 13 |
| 8 | Runs Batted In | 0 |
| 0 | Sacrifice Hit | 0 |
| 10 | Hits | 1 |
| 0 | Stolen Bases | 0 |
| 3 | Walks | 0 |
| 0 | Catcher Interference | 0 |
| 8 | Runs | 0 |
| 0 | Ground Into Double Play | 0 |
| 0 | Sacrifice Flies | 0 |
| 37 | At Bats | 28 |
| 3 | Home Runs | 0 |
| 0 | Grand Slam Home Runs | 0 |
| 13 | Runners Left On Base | 2 |
| 0 | Triples | 0 |
| 1 | Game Winning RBIs | 0 |
| 0 | Intentional Walks | 0 |
| 3 | Doubles | 0 |
| 15 | Fly Balls | 9 |
| 0 | Caught Stealing | 0 |
| 149 | Pitches | 114 |
| 0 | Games Started | 0 |
| 0 | Pinch At Bats | 3 |
| 0 | Pinch Hits | 0 |
| 0.0 | Player Rating | 0.0 |
| 1 | Is Qualified | 1 |
| 0 | Is Qualified In Steals | 0 |
| 22 | Total Bases | 1 |
| 40 | Plate Appearances | 28 |
| 486.0 | Projected Home Runs | 0.0 |
| 6 | Extra Base Hits | 0 |
| 7.2 | Runs Created | -2.3 |
| .270 | Batting Average | .036 |
| .000 | Pinch Hit Average | .000 |
| .595 | Slugging Percentage | .036 |
| .405 | Secondary Average | .000 |
| .325 | On Base Percentage | .036 |
| .920 | OBP Pct + SLG Pct | .071 |
| 0.9 | Ground To Fly Ball Ratio | 0.7 |
| 7.2 | Runs Created Per 27 Outs | -2.3 |
| 57.0 | Batter Rating | 1.0 |
| 12.3 | At Bats Per Home Run | 0.0 |
| 0.00 | Stolen Base Percentage | 0.00 |
| 3.73 | Pitches Per Plate Appearance | 4.07 |
| .324 | Isolated Power | .000 |
| 0.38 | Walk To Strikeout Ratio | 0.00 |
| .075 | Walks Per Plate Appearance | .000 |
| .135 | Secondary Average Minus Batting Average | -.036 |
| 16.0 | Runs Produced | 0.0 |
| 1.0 | Runs Ratio | 0.0 |
| 0.6 | Patience Ratio | 0.0 |
| 0.3 | Balls In Play Average | 0.1 |
| 99.0 | MLB Rating | 51.0 |
| 0.0 | Offensive Wins Above Replacement | 0.0 |
| 0.0 | Wins Above Replacement | 0.0 |
Game Information

Location: Washington, District of Columbia
Attendance: 22,473 | Capacity: