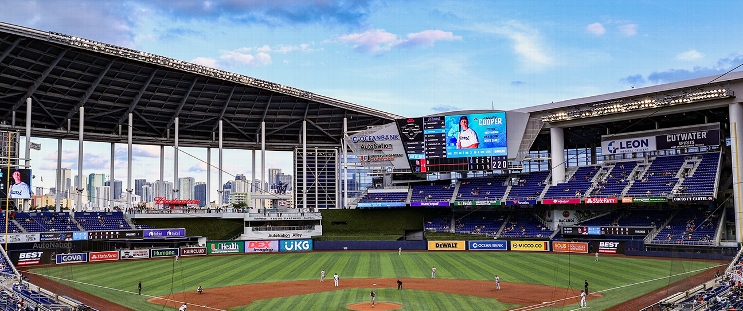
New York Mets at Miami Marlins
· Major League Baseball
0 - 4

Cabrera pitches Marlins past Mets 4-0 to eliminate New York from playoff field

The Mets (83-79) needed a win and a Cincinnati loss at Milwaukee to reach the postseason. The Reds (83-79) lost 4-2 to the Brewers but took the final National League wild card on a head-to-head tiebreaker after winning the season series against New York.
Cabrera (8-7) struck out seven and walked five.
Mets starter Sean Manaea fanned three in 1 2/3 hitless innings. But with little margin for error, manager Carlos Mendoza pulled Manaea following his second walk in the second, and reliever Huascar Brazobán got out of the inning.
Connor Norby began the Miami fourth with a single off reliever Brooks Raley (3-1).
Raley was replaced by Ryne Stanek — already the fourth Mets pitcher — and he gave up a run-scoring double to Eric Wagaman that put the Marlins on the board. Brian Navarreto hit another RBI double, followed by a run-scoring triple from Javier Sanoja and an RBI single by Xavier Edwards off Tyler Rogers.
The Mets used eight pitchers, including closer Edwin Díaz, who pitched scoreless innings in the fifth and sixth.
Francisco Lindor doubled in the seventh for one of five Mets hits, but New York went 0 for 8 with runners in scoring position and stranded 10 overall. The season ended when Lindor grounded into a game-ending double play.
The Marlins won the season series from their division rivals, 7-6.
How can I watch New York Mets vs. Miami Marlins?
- TV Channel: Mets at Marlins 2022 MLB Baseball, is broadcasted on MLB.TV.
- Online streaming: Sign up for Fubo.
Scoring Summary
 |
9th Inning | Lindor grounded into double play, second to shortstop to first, Mauricio out at second. |
 |
9th Inning | Mullins flied out to right. |
 |
9th Inning | Mauricio walked. |
 |
9th Inning | Phillips relieved Faucher |
 |
9th Inning | Wiemer in right field. |
 |
9th Inning | Pauley at third base. |
Statistics
 NYM NYM |
 MIA MIA |
|
|---|---|---|
| 1 | Games Played | 1 |
| 1 | Team Games Played | 1 |
| 0 | Hit By Pitch | 1 |
| 9 | Ground Balls | 12 |
| 11 | Strikeouts | 6 |
| 0 | Runs Batted In | 4 |
| 0 | Sacrifice Hit | 0 |
| 5 | Hits | 9 |
| 2 | Stolen Bases | 3 |
| 7 | Walks | 3 |
| 0 | Catcher Interference | 0 |
| 0 | Runs | 4 |
| 2 | Ground Into Double Play | 0 |
| 0 | Sacrifice Flies | 0 |
| 30 | At Bats | 33 |
| 0 | Home Runs | 0 |
| 0 | Grand Slam Home Runs | 0 |
| 20 | Runners Left On Base | 15 |
| 0 | Triples | 1 |
| 0 | Game Winning RBIs | 1 |
| 0 | Intentional Walks | 0 |
| 1 | Doubles | 3 |
| 10 | Fly Balls | 15 |
| 0 | Caught Stealing | 0 |
| 149 | Pitches | 142 |
| 0 | Games Started | 0 |
| 1 | Pinch At Bats | 0 |
| 0 | Pinch Hits | 0 |
| 0.0 | Player Rating | 0.0 |
| 1 | Is Qualified | 1 |
| 1 | Is Qualified In Steals | 1 |
| 6 | Total Bases | 14 |
| 37 | Plate Appearances | 37 |
| 0.0 | Projected Home Runs | 0.0 |
| 1 | Extra Base Hits | 4 |
| 2.2 | Runs Created | 5.8 |
| .167 | Batting Average | .273 |
| .000 | Pinch Hit Average | .000 |
| .200 | Slugging Percentage | .424 |
| .333 | Secondary Average | .333 |
| .324 | On Base Percentage | .351 |
| .524 | OBP Pct + SLG Pct | .776 |
| 0.9 | Ground To Fly Ball Ratio | 0.8 |
| 2.2 | Runs Created Per 27 Outs | 6.5 |
| 9.0 | Batter Rating | 36.5 |
| 0.0 | At Bats Per Home Run | 0.0 |
| 1.00 | Stolen Base Percentage | 1.00 |
| 4.03 | Pitches Per Plate Appearance | 3.84 |
| .033 | Isolated Power | .152 |
| 0.64 | Walk To Strikeout Ratio | 0.50 |
| .189 | Walks Per Plate Appearance | .081 |
| .167 | Secondary Average Minus Batting Average | .061 |
| 0.0 | Runs Produced | 8.0 |
| 0.0 | Runs Ratio | 1.0 |
| 0.4 | Patience Ratio | 0.5 |
| 0.3 | Balls In Play Average | 0.3 |
| 63.3 | MLB Rating | 84.3 |
| 0.0 | Offensive Wins Above Replacement | 0.0 |
| 0.0 | Wins Above Replacement | 0.0 |
Game Information

Location: Miami, Florida
Attendance: 34,660 | Capacity:
2026 National League East Standings
| TEAM | W | L | PCT | GB | STRK |
|---|---|---|---|---|---|
 Atlanta Atlanta |
0 | 0 | .000 | - | - |
 Washington Washington |
0 | 0 | .000 | - | - |
 New York New York |
0 | 0 | .000 | - | - |
 Philadelphia Philadelphia |
0 | 0 | .000 | - | - |
 Miami Miami |
0 | 0 | .000 | - | - |