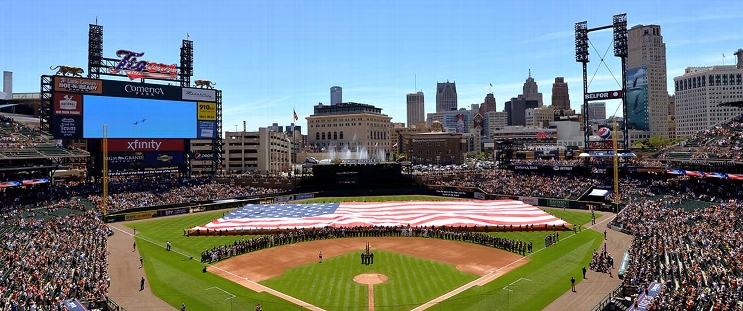
Baltimore Orioles at Detroit Tigers
· Doubleheader - Game 2 - Makeup from April 25
2 - 6

Greene's 3-run homer off Morton helps Tigers sweep doubleheader from Orioles 4-3 and 6-2

After Gunnar Henderson's RBI double off Keider Montero put Baltimore ahead in the third, but left fielder Zach McKinstry prevented a second run by throwing out Cedric Mullins at the plate.
Greene hit his fourth homer of the season in the bottom half on a fastball from Morton (0-6), who replaced Keegan Akin in the second and allowed three runs, three hits and five walks in 3 2/3 innings. Morton leads the major leagues in losses.
Detroit is 7-2 on its homestand.
Baltimore has lost five of six and dropped to 1-4 on its trip.
Ramón Laureano nearly tied the game in the sixth, but McKinstry made a running catch in left to prevent a two-run double and hold Laureano to a sacrifice fly.
Spencer Torkelson, who homered in the first game, made it 5-2 with a two-run double in a three-run seventh that included McKinstry's RBI double off Grant Wolfram.
Akin made his first start since May 31, 2023, and faced six batters.
How can I watch Baltimore Orioles vs. Detroit Tigers?
- TV Channel: Orioles at Tigers 2022 MLB Baseball, is broadcasted on MLB.TV.
- Online streaming: Sign up for Fubo.
Scoring Summary
 |
9th Inning | Mullins struck out swinging. |
 |
9th Inning | Urías walked. |
 |
9th Inning | Holliday grounded out to first. |
 |
9th Inning | Mountcastle grounded out to third. |
 |
9th Inning | Kahnle relieved Lee |
 |
8th Inning | Torres grounded out to third. |
Statistics
 BAL BAL |
 DET DET |
|
|---|---|---|
| 1 | Games Played | 1 |
| 1 | Team Games Played | 1 |
| 1 | Hit By Pitch | 0 |
| 9 | Ground Balls | 9 |
| 5 | Strikeouts | 7 |
| 2 | Runs Batted In | 6 |
| 0 | Sacrifice Hit | 0 |
| 6 | Hits | 6 |
| 0 | Stolen Bases | 1 |
| 5 | Walks | 8 |
| 0 | Catcher Interference | 0 |
| 2 | Runs | 6 |
| 1 | Ground Into Double Play | 1 |
| 1 | Sacrifice Flies | 0 |
| 30 | At Bats | 29 |
| 0 | Home Runs | 1 |
| 0 | Grand Slam Home Runs | 0 |
| 16 | Runners Left On Base | 18 |
| 0 | Triples | 0 |
| 0 | Game Winning RBIs | 1 |
| 0 | Intentional Walks | 0 |
| 1 | Doubles | 2 |
| 17 | Fly Balls | 13 |
| 0 | Caught Stealing | 0 |
| 156 | Pitches | 164 |
| 0 | Games Started | 0 |
| 0 | Pinch At Bats | 1 |
| 0 | Pinch Hits | 0 |
| 0.0 | Player Rating | 0.0 |
| 1 | Is Qualified | 1 |
| 0 | Is Qualified In Steals | 1 |
| 7 | Total Bases | 11 |
| 37 | Plate Appearances | 37 |
| 0.0 | Projected Home Runs | 162.0 |
| 1 | Extra Base Hits | 3 |
| 2.6 | Runs Created | 4.8 |
| .200 | Batting Average | .207 |
| .000 | Pinch Hit Average | .000 |
| .233 | Slugging Percentage | .379 |
| .200 | Secondary Average | .483 |
| .324 | On Base Percentage | .378 |
| .558 | OBP Pct + SLG Pct | .758 |
| 0.5 | Ground To Fly Ball Ratio | 0.7 |
| 2.7 | Runs Created Per 27 Outs | 5.4 |
| 16.0 | Batter Rating | 38.0 |
| 0.0 | At Bats Per Home Run | 29.0 |
| 0.00 | Stolen Base Percentage | 1.00 |
| 4.22 | Pitches Per Plate Appearance | 4.43 |
| .033 | Isolated Power | .172 |
| 1.00 | Walk To Strikeout Ratio | 1.14 |
| .135 | Walks Per Plate Appearance | .216 |
| .000 | Secondary Average Minus Batting Average | .276 |
| 4.0 | Runs Produced | 12.0 |
| 1.0 | Runs Ratio | 1.0 |
| 0.4 | Patience Ratio | 0.6 |
| 0.2 | Balls In Play Average | 0.2 |
| 70.5 | MLB Rating | 82.8 |
| 0.0 | Offensive Wins Above Replacement | 0.0 |
| 0.0 | Wins Above Replacement | 0.0 |
Game Information

Location: Detroit, Michigan
Attendance: 21,422 | Capacity:
2025 American League East Standings
| TEAM | W | L | PCT | GB | STRK |
|---|---|---|---|---|---|
 Toronto Toronto |
94 | 68 | .580 | - | W4 |
 New York New York |
94 | 68 | .580 | - | W8 |
 Boston Boston |
89 | 73 | .549 | 5 | W1 |
 Tampa Bay Tampa Bay |
77 | 85 | .475 | 17 | L4 |
 Baltimore Baltimore |
75 | 87 | .463 | 19 | L3 |
2025 American League Central Standings
| TEAM | W | L | PCT | GB | STRK |
|---|---|---|---|---|---|
 Cleveland Cleveland |
88 | 74 | .543 | - | W2 |
 Detroit Detroit |
87 | 75 | .537 | 1 | L1 |
 Kansas City Kansas City |
82 | 80 | .506 | 6 | W2 |
 Minnesota Minnesota |
70 | 92 | .432 | 18 | L1 |
 Chicago Chicago |
60 | 102 | .370 | 28 | W1 |