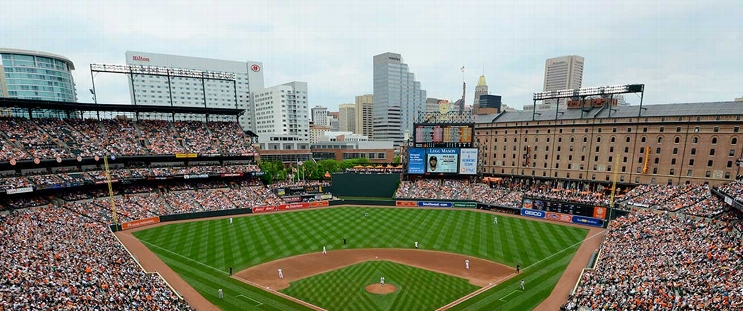
Minnesota Twins at Baltimore Orioles
· Doubleheader - Game 2 - Makeup from May 13
8 - 6

Twins rally to their 10th straight win, beat Baltimore 8-6 for a doubleheader sweep

Minnesota rallied from a 3-0 deficit to win the opener 6-3, then fell behind 6-4 before coming back in the second game. The Twins trailed by a run when Willi Castro led off the eighth with a single, stole second and advanced to third on a balk by Yennier Cano (0-3). After a walk to Royce Lewis, Clemens hit a drive to right to give Minnesota the lead.
Kody Funderburk (1-0) won in relief. Cole Sands pitched a perfect ninth for his first save.
The Orioles scored six runs in the third — thanks largely to a grand slam by Cedric Mullins and a solo shot by Heston Kjerstad — but managed no further scoring.
Trevor Larnach hit a two-run homer in the second for Minnesota. The Twins led 4-0 before Baltimore's big third inning.
Minnesota outfielder Harrison Bader left the game with left groin tightness. First baseman Ty France didn't play after leaving the opener with a foot issue.
How can I watch Minnesota Twins vs. Baltimore Orioles?
- TV Channel: Twins at Orioles 2022 MLB Baseball, is broadcasted on MLB.TV.
- Online streaming: Sign up for Fubo.
Scoring Summary
 |
9th Inning | Henderson flied out to center. |
 |
9th Inning | Mountcastle flied out to right. |
 |
9th Inning | Holliday grounded out to second. |
 |
9th Inning | Sands relieved Topa |
 |
9th Inning | Castro grounded into double play, second to shortstop to first, Lee out at second. |
 |
9th Inning | Lee singled to left, Jeffers to second. |
Statistics
 MIN MIN |
 BAL BAL |
|
|---|---|---|
| 1 | Games Played | 1 |
| 1 | Team Games Played | 1 |
| 1 | Hit By Pitch | 0 |
| 12 | Ground Balls | 15 |
| 11 | Strikeouts | 7 |
| 8 | Runs Batted In | 6 |
| 0 | Sacrifice Hit | 0 |
| 10 | Hits | 11 |
| 1 | Stolen Bases | 0 |
| 6 | Walks | 2 |
| 0 | Catcher Interference | 0 |
| 8 | Runs | 6 |
| 2 | Ground Into Double Play | 1 |
| 0 | Sacrifice Flies | 0 |
| 34 | At Bats | 37 |
| 3 | Home Runs | 2 |
| 0 | Grand Slam Home Runs | 1 |
| 15 | Runners Left On Base | 11 |
| 0 | Triples | 0 |
| 1 | Game Winning RBIs | 0 |
| 0 | Intentional Walks | 0 |
| 0 | Doubles | 0 |
| 11 | Fly Balls | 15 |
| 0 | Caught Stealing | 0 |
| 152 | Pitches | 145 |
| 0 | Games Started | 0 |
| 0 | Pinch At Bats | 2 |
| 0 | Pinch Hits | 0 |
| 0.0 | Player Rating | 0.0 |
| 1 | Is Qualified | 1 |
| 1 | Is Qualified In Steals | 0 |
| 19 | Total Bases | 17 |
| 41 | Plate Appearances | 39 |
| 486.0 | Projected Home Runs | 324.0 |
| 3 | Extra Base Hits | 2 |
| 7.4 | Runs Created | 5.3 |
| .294 | Batting Average | .297 |
| .000 | Pinch Hit Average | .000 |
| .559 | Slugging Percentage | .459 |
| .471 | Secondary Average | .216 |
| .415 | On Base Percentage | .333 |
| .973 | OBP Pct + SLG Pct | .793 |
| 1.1 | Ground To Fly Ball Ratio | 1.0 |
| 7.7 | Runs Created Per 27 Outs | 5.3 |
| 52.0 | Batter Rating | 41.0 |
| 11.3 | At Bats Per Home Run | 18.5 |
| 1.00 | Stolen Base Percentage | 0.00 |
| 3.71 | Pitches Per Plate Appearance | 3.72 |
| .265 | Isolated Power | .162 |
| 0.55 | Walk To Strikeout Ratio | 0.29 |
| .146 | Walks Per Plate Appearance | .051 |
| .176 | Secondary Average Minus Batting Average | -.081 |
| 16.0 | Runs Produced | 12.0 |
| 1.0 | Runs Ratio | 1.0 |
| 0.7 | Patience Ratio | 0.5 |
| 0.4 | Balls In Play Average | 0.3 |
| 97.3 | MLB Rating | 91.3 |
| 0.0 | Offensive Wins Above Replacement | 0.0 |
| 0.0 | Wins Above Replacement | 0.0 |
Game Information

Location: Baltimore, Maryland
Attendance: 10,169 | Capacity:
2025 American League Central Standings
| TEAM | W | L | PCT | GB | STRK |
|---|---|---|---|---|---|
 Cleveland Cleveland |
88 | 74 | .543 | - | W2 |
 Detroit Detroit |
87 | 75 | .537 | 1 | L1 |
 Kansas City Kansas City |
82 | 80 | .506 | 6 | W2 |
 Minnesota Minnesota |
70 | 92 | .432 | 18 | L1 |
 Chicago Chicago |
60 | 102 | .370 | 28 | W1 |
2025 American League East Standings
| TEAM | W | L | PCT | GB | STRK |
|---|---|---|---|---|---|
 Toronto Toronto |
94 | 68 | .580 | - | W4 |
 New York New York |
94 | 68 | .580 | - | W8 |
 Boston Boston |
89 | 73 | .549 | 5 | W1 |
 Tampa Bay Tampa Bay |
77 | 85 | .475 | 17 | L4 |
 Baltimore Baltimore |
75 | 87 | .463 | 19 | L3 |