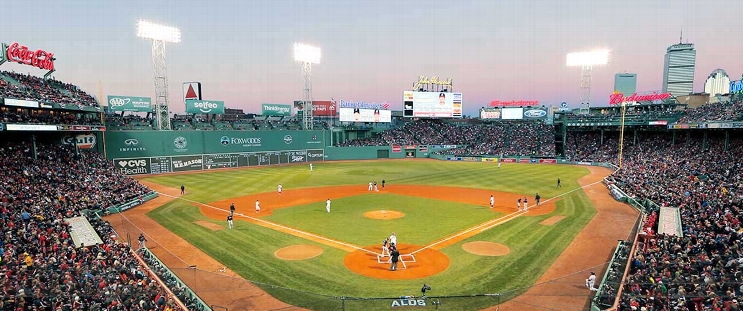
Baltimore Orioles at Boston Red Sox
· Doubleheader - Game 1 - Makeup from May 22
5 - 19

Devers has career-high 8 RBIs, including grand slam in 13-run 8th as Red Sox rout O's 19-5 in opener

Boston trailed 2-1 entering the sixth, when Ceddanne Rafaela hit an RBI single off Seranthony Domínguez (2-1), Jarren Duran had an RBI single against Gregory Soto and Devers followed with his fifth homer in 10 career at-bats against Soto.
Devers had four hits and leads the major leagues with 47 RBI. He hit his seventh career slam and his second in a six-day span, his 12th homer this season. The drive came off rookie infielder Emmanuel Rivera, who gave up eight runs and got three outs, leaving him with a 72.00 ERA. Devers hit an RBI single earlier in the inning against Cionel Pérez.
Boston scored its most runs since a 20-8 win over Toronto on Aug. 11, 2021, and finished with 20 hits. The 13-run inning was the highest in the major leagues this year and the most for the Red Sox since a 14-run first against the Florida Marlins on June 27, 2003.
Baltimore has lost nine of 10 and and 15 of 18, dropping to 16-33. The Orioles are 1-5 since manager Brandon Hyde was fired and replaced on an interim basis by third base coach Tony Mansolino.
Alex Bregman left with right quadriceps tightness after singling in the fifth inning.
Rob Redsnyder had four RBI, including a three-run homer in the eighth off Pérez. Duran had three RBI.
Garrett Whitlock (3-0) allowed one hit in two scoreless innings.
How can I watch Baltimore Orioles vs. Boston Red Sox?
- TV Channel: Orioles at Red Sox 2022 MLB Baseball, is broadcasted on MLB Net.
- Online streaming: Sign up for Fubo.
Scoring Summary
 |
9th Inning | Mullins grounded out to second. |
 |
9th Inning | Urías popped out to second. |
 |
9th Inning | O'Hearn singled to center, Henderson to second, Rutschman to third. |
 |
9th Inning | Mountcastle hit sacrifice fly to right, Holliday scored. |
 |
9th Inning | Henderson singled to left, Rutschman to second, Holliday to third. |
 |
9th Inning | Rutschman walked. |
Statistics
 BAL BAL |
 BOS BOS |
|
|---|---|---|
| 1 | Games Played | 1 |
| 1 | Team Games Played | 1 |
| 0 | Hit By Pitch | 0 |
| 13 | Ground Balls | 16 |
| 11 | Strikeouts | 7 |
| 5 | Runs Batted In | 19 |
| 0 | Sacrifice Hit | 0 |
| 14 | Hits | 20 |
| 1 | Stolen Bases | 0 |
| 3 | Walks | 8 |
| 0 | Catcher Interference | 0 |
| 5 | Runs | 19 |
| 0 | Ground Into Double Play | 1 |
| 1 | Sacrifice Flies | 0 |
| 39 | At Bats | 45 |
| 0 | Home Runs | 3 |
| 0 | Grand Slam Home Runs | 1 |
| 25 | Runners Left On Base | 18 |
| 0 | Triples | 0 |
| 0 | Game Winning RBIs | 1 |
| 0 | Intentional Walks | 0 |
| 3 | Doubles | 6 |
| 16 | Fly Balls | 22 |
| 1 | Caught Stealing | 0 |
| 164 | Pitches | 217 |
| 0 | Games Started | 0 |
| 0 | Pinch At Bats | 0 |
| 0 | Pinch Hits | 0 |
| 0.0 | Player Rating | 0.0 |
| 1 | Is Qualified | 1 |
| 1 | Is Qualified In Steals | 0 |
| 17 | Total Bases | 35 |
| 43 | Plate Appearances | 53 |
| 0.0 | Projected Home Runs | 486.0 |
| 3 | Extra Base Hits | 9 |
| 6.8 | Runs Created | 15.6 |
| .359 | Batting Average | .444 |
| .000 | Pinch Hit Average | .000 |
| .436 | Slugging Percentage | .778 |
| .154 | Secondary Average | .511 |
| .395 | On Base Percentage | .528 |
| .831 | OBP Pct + SLG Pct | 1.306 |
| 0.8 | Ground To Fly Ball Ratio | 0.7 |
| 6.8 | Runs Created Per 27 Outs | 16.2 |
| 41.0 | Batter Rating | 117.0 |
| 0.0 | At Bats Per Home Run | 15.0 |
| 0.50 | Stolen Base Percentage | 0.00 |
| 3.81 | Pitches Per Plate Appearance | 4.09 |
| .077 | Isolated Power | .333 |
| 0.27 | Walk To Strikeout Ratio | 1.14 |
| .070 | Walks Per Plate Appearance | .151 |
| -.205 | Secondary Average Minus Batting Average | .067 |
| 10.0 | Runs Produced | 38.0 |
| 1.0 | Runs Ratio | 1.0 |
| 0.5 | Patience Ratio | 0.9 |
| 0.5 | Balls In Play Average | 0.5 |
| 92.0 | MLB Rating | 146.0 |
| 0.0 | Offensive Wins Above Replacement | 0.0 |
| 0.0 | Wins Above Replacement | 0.0 |
Game Information

Location: Boston, Massachusetts
Attendance: 31,150 | Capacity:
2025 American League East Standings
| TEAM | W | L | PCT | GB | STRK |
|---|---|---|---|---|---|
 Toronto Toronto |
94 | 68 | .580 | - | W4 |
 New York New York |
94 | 68 | .580 | - | W8 |
 Boston Boston |
89 | 73 | .549 | 5 | W1 |
 Tampa Bay Tampa Bay |
77 | 85 | .475 | 17 | L4 |
 Baltimore Baltimore |
75 | 87 | .463 | 19 | L3 |