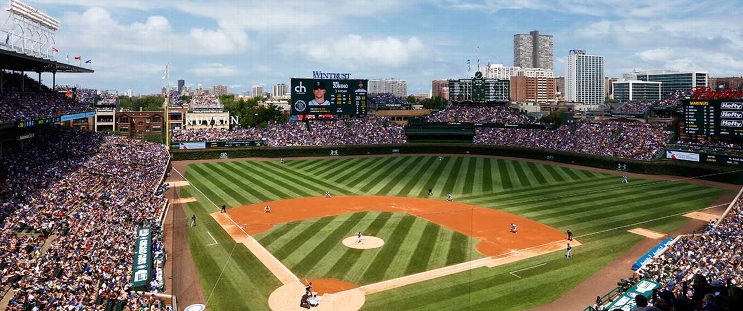
San Diego Padres at Chicago Cubs
· NLWC - Game 3
1 - 3

Cubs beat Padres 3-1 to clinch Wild Card Series, advance to NL Division Series against the Brewers

Backed by a raucous crowd of 40,895 at Wrigley Field, Chicago used its stellar defense to advance in the postseason for the first time since 2017.
Michael Busch hit a solo homer, and Jameson Taillon pitched four shutout innings before manager Craig Counsell used five relievers to close it out.
After Brad Keller faltered in the ninth — allowing Jackson Merrill’s leadoff homer and hitting two batters — Andrew Kittredge earned the save by retiring Jake Cronenworth on a bouncer to third and Freddy Fermin on a flyball to center.
Next up for Chicago is a matchup with NL Central champion Milwaukee for a compelling NL Division Series, beginning with Game 1 on Saturday.
Counsell managed the Brewers for nine years before he was hired by the Cubs in November 2023, and he has been lustily booed in Milwaukee ever since he departed.
It was a disappointing finish for San Diego after it made the postseason for the fourth time in the last six years. The Padres forced a decisive Game 3 with a 3-0 victory on Wednesday, but their biggest stars flopped in the series finale.
How can I watch San Diego Padres vs. Chicago Cubs?
- TV Channel: Padres at Cubs 2022 MLB Baseball, is broadcasted on ESPN.
- Online streaming: Sign up for Fubo.
Scoring Summary
 |
9th Inning | Fermin flied out to center. |
 |
9th Inning | Cronenworth grounded out to third, Johnson to second, O'Hearn to third. |
 |
9th Inning | Kittredge relieved Keller |
 |
9th Inning | Johnson hit by pitch, O'Hearn to second. |
 |
9th Inning | O'Hearn hit by pitch. |
 |
9th Inning | Bogaerts struck out looking. |
Statistics
 SD SD |
 CHC CHC |
|
|---|---|---|
| 1 | Games Played | 1 |
| 1 | Team Games Played | 1 |
| 2 | Hit By Pitch | 1 |
| 9 | Ground Balls | 10 |
| 8 | Strikeouts | 11 |
| 1 | Runs Batted In | 3 |
| 0 | Sacrifice Hit | 1 |
| 7 | Hits | 13 |
| 1 | Stolen Bases | 0 |
| 1 | Walks | 1 |
| 0 | Catcher Interference | 0 |
| 1 | Runs | 3 |
| 1 | Ground Into Double Play | 2 |
| 0 | Sacrifice Flies | 0 |
| 33 | At Bats | 32 |
| 1 | Home Runs | 1 |
| 0 | Grand Slam Home Runs | 0 |
| 16 | Runners Left On Base | 20 |
| 0 | Triples | 0 |
| 0 | Game Winning RBIs | 1 |
| 0 | Intentional Walks | 0 |
| 2 | Doubles | 3 |
| 16 | Fly Balls | 12 |
| 0 | Caught Stealing | 2 |
| 147 | Pitches | 136 |
| 0 | Games Started | 0 |
| 1 | Pinch At Bats | 0 |
| 0 | Pinch Hits | 0 |
| 0.0 | Player Rating | 0.0 |
| 1 | Is Qualified | 1 |
| 1 | Is Qualified In Steals | 1 |
| 12 | Total Bases | 19 |
| 36 | Plate Appearances | 35 |
| 162.0 | Projected Home Runs | 162.0 |
| 3 | Extra Base Hits | 4 |
| 3.3 | Runs Created | 6.1 |
| .212 | Batting Average | .406 |
| .000 | Pinch Hit Average | .000 |
| .364 | Slugging Percentage | .594 |
| .212 | Secondary Average | .156 |
| .278 | On Base Percentage | .441 |
| .641 | OBP Pct + SLG Pct | 1.035 |
| 0.6 | Ground To Fly Ball Ratio | 0.8 |
| 3.3 | Runs Created Per 27 Outs | 6.9 |
| 19.0 | Batter Rating | 34.0 |
| 33.0 | At Bats Per Home Run | 32.0 |
| 1.00 | Stolen Base Percentage | 0.00 |
| 4.08 | Pitches Per Plate Appearance | 3.89 |
| .152 | Isolated Power | .188 |
| 0.13 | Walk To Strikeout Ratio | 0.09 |
| .028 | Walks Per Plate Appearance | .029 |
| .000 | Secondary Average Minus Batting Average | -.250 |
| 2.0 | Runs Produced | 6.0 |
| 1.0 | Runs Ratio | 1.0 |
| 0.4 | Patience Ratio | 0.6 |
| 0.3 | Balls In Play Average | 0.6 |
| 72.5 | MLB Rating | 89.8 |
| 0.0 | Offensive Wins Above Replacement | 0.0 |
| 0.0 | Wins Above Replacement | 0.0 |
Game Information

Location: Chicago, Illinois
Attendance: 40,895 | Capacity:
2026 National League West Standings
| TEAM | W | L | PCT | GB | STRK |
|---|---|---|---|---|---|
 Los Angeles Los Angeles |
0 | 0 | .000 | - | - |
 San Diego San Diego |
0 | 0 | .000 | - | - |
 San Francisco San Francisco |
0 | 0 | .000 | - | - |
 Colorado Colorado |
0 | 0 | .000 | - | - |
 Arizona Arizona |
0 | 0 | .000 | - | - |
2026 National League Central Standings
| TEAM | W | L | PCT | GB | STRK |
|---|---|---|---|---|---|
 Milwaukee Milwaukee |
0 | 0 | .000 | - | - |
 Chicago Chicago |
0 | 0 | .000 | - | - |
 Cincinnati Cincinnati |
0 | 0 | .000 | - | - |
 Pittsburgh Pittsburgh |
0 | 0 | .000 | - | - |
 St. Louis St. Louis |
0 | 0 | .000 | - | - |