
Seattle Mariners at Detroit Tigers
· ALDS - Game 3
8 - 4

Raleigh, Suarez, Crawford homer and Mariners top Tigers 8-4 for a 2-1 lead in the AL Division Series
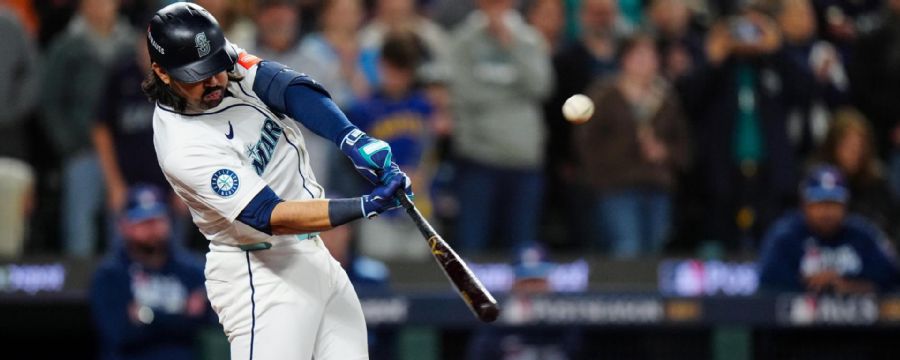
Cal Raleigh hit a two-run homer, Eugenio Suarez and J.P. Crawford had solo shots and Seattle beat the Detroit Tigers 8-4 on Tuesday night to take a 2-1 lead in the AL Division Series.
The Mariners are within a win of their first AL Championship Series since 2001. Their first chance to advance is on Wednesday afternoon in Game 4 at Comerica Park and if necessary, another opportunity awaits on Friday back in Seattle for a decisive Game 5.
"The Seattle Mariners deserve where we’re at right now," Suarez said.
Detroit manager A.J. Hinch said not to count his team out after it showed resolve following a historic collapse in the regular season and bounced back by eliminating Cleveland in an AL Wild Card series, then won Game 1 against Seattle.
“We’ve had to play more and more back-against-the-wall-type games,” Hinch said. “I know our guys are going to be ready.”
Seattle’s Logan Gilbert gave up one run on four hits while striking out seven and walking none over six innings.
“Can’t say enough about what Logan did," Mariners manager Dan Wilson said. "Just an incredible outing. He had everything going.”
Raleigh, who had a major league-high 60 homers during the regular season, hit a 391-foot, two-run homer to left-center in the ninth to make it 8-1.
The offensively challenged Tigers were limited to four hits and one run through eight innings before suddenly generating some offense in the ninth against Caleb Ferguson, who allowed three runs on three hits and a walk without getting an out.
Spencer Torkelson hit a two-run double and Andy Ibanez followed with an RBI single.
All-Star closer Andres Munoz entered with one on and no outs and ended Detroit's comeback hopes with a flyout and game-ending double play.
Detroit's Jack Flaherty lasted just 3 1/3 innings, allowing four runs (three earned) on four hits and three walks.
Seattle scored two runs in the third after starting the inning with three hits and a walk.
Victor Robles led off with a double and scored on an error, which was credited to left fielder Riley Greene for an errant throw that could have been fielded on a bounce by catcher Dillon Dingler.
“A little bit of a breakdown all the way around,” Hinch said.
Randy Arozarena's RBI single put the Mariners ahead 2-0 in the third.
Suarez sent a 422-foot shot to left in the fourth to make it 3-0. Raleigh's two-out RBI single in the inning gave Seattle a four-run cushion.
The Tigers were hoping their first home game in two-plus weeks might make them more comfortable at the plate, but it didn't help and they lost an eighth straight at Comerica Park.
Detroit finally scored in the fifth on Kerry Carpenter’s fielder's choice on what was potentially an inning-ending double play. Crawford’s throw from second base pulled first baseman Josh Naylor off the bag and he didn’t secure the ball in his glove, allowing Dingler to score.
Crawford's homer in the sixth restored Seattle's four-run lead.
The Tigers allowed the Mariners to score a second unearned run in the eighth inning after Carpenter dropped Victor Robles' fly in right field, allowing Luke Raley to advance to third and to score on Crawford's sacrifice fly.
Follow Larry Lage on X
How can I watch Seattle Mariners vs. Detroit Tigers?
- TV Channel: Mariners at Tigers 2022 MLB Baseball, is broadcasted on FS2.
- Online streaming: Sign up for Fubo.
Scoring Summary
 |
9th Inning | Meadows lined into double play, to first, Ibáñez doubled off first. |
|
9th Inning | Dingler flied out to left. |
 |
9th Inning | Muñoz relieved Ferguson |
|
9th Inning | Ibáñez singled to right, Torkelson scored. |
|
9th Inning | Ibáñez hit for McKinstry |
|
9th Inning | Torkelson doubled to right, Jones scored and Rogers scored. |
Statistics
 SEA SEA |
 DET DET |
|
|---|---|---|
| 1 | Games Played | 1 |
| 1 | Team Games Played | 1 |
| 1 | Hit By Pitch | 1 |
| 8 | Ground Balls | 13 |
| 10 | Strikeouts | 9 |
| 7 | Runs Batted In | 4 |
| 0 | Sacrifice Hit | 1 |
| 8 | Hits | 7 |
| 0 | Stolen Bases | 0 |
| 5 | Walks | 1 |
| 0 | Catcher Interference | 0 |
| 8 | Runs | 4 |
| 0 | Ground Into Double Play | 0 |
| 1 | Sacrifice Flies | 0 |
| 34 | At Bats | 32 |
| 3 | Home Runs | 0 |
| 0 | Grand Slam Home Runs | 0 |
| 14 | Runners Left On Base | 8 |
| 0 | Triples | 0 |
| 0 | Game Winning RBIs | 0 |
| 0 | Intentional Walks | 0 |
| 2 | Doubles | 2 |
| 17 | Fly Balls | 11 |
| 1 | Caught Stealing | 0 |
| 146 | Pitches | 135 |
| 0 | Games Started | 0 |
| 1 | Pinch At Bats | 2 |
| 0 | Pinch Hits | 2 |
| 0.0 | Player Rating | 0.0 |
| 1 | Is Qualified | 1 |
| 1 | Is Qualified In Steals | 0 |
| 19 | Total Bases | 9 |
| 41 | Plate Appearances | 35 |
| 486.0 | Projected Home Runs | 0.0 |
| 5 | Extra Base Hits | 2 |
| 6.5 | Runs Created | 2.4 |
| .235 | Batting Average | .219 |
| .000 | Pinch Hit Average | 1.000 |
| .559 | Slugging Percentage | .281 |
| .441 | Secondary Average | .094 |
| .341 | On Base Percentage | .265 |
| .900 | OBP Pct + SLG Pct | .546 |
| 0.5 | Ground To Fly Ball Ratio | 1.2 |
| 6.3 | Runs Created Per 27 Outs | 2.5 |
| 51.0 | Batter Rating | 27.0 |
| 11.3 | At Bats Per Home Run | 0.0 |
| 0.00 | Stolen Base Percentage | 0.00 |
| 3.56 | Pitches Per Plate Appearance | 3.86 |
| .324 | Isolated Power | .063 |
| 0.50 | Walk To Strikeout Ratio | 0.11 |
| .122 | Walks Per Plate Appearance | .029 |
| .206 | Secondary Average Minus Batting Average | -.125 |
| 15.0 | Runs Produced | 8.0 |
| 0.9 | Runs Ratio | 1.0 |
| 0.7 | Patience Ratio | 0.3 |
| 0.2 | Balls In Play Average | 0.3 |
| 93.5 | MLB Rating | 75.3 |
| 0.0 | Offensive Wins Above Replacement | 0.0 |
| 0.0 | Wins Above Replacement | 0.0 |
Game Information

Location: Detroit, Michigan
Attendance: 41,525 | Capacity:
2026 American League West Standings
| TEAM | W | L | PCT | GB | STRK |
|---|---|---|---|---|---|
| <img src="https://a.espncdn.com/i/teamlogos/mlb/500/sea.png" class="logo-micro">Seattle | 46 | 44 | .511 | - | W1 |
| <img src="https://a.espncdn.com/i/teamlogos/mlb/500/tex.png" class="logo-micro">Texas | 45 | 44 | .506 | 0.5 | L1 |
| <img src="https://a.espncdn.com/i/teamlogos/mlb/500/hou.png" class="logo-micro">Houston | 44 | 47 | .484 | 2.5 | W1 |
| <img src="https://a.espncdn.com/i/teamlogos/mlb/500/ath.png" class="logo-micro">Athletics | 41 | 48 | .461 | 4.5 | L2 |
| <img src="https://a.espncdn.com/i/teamlogos/mlb/500/laa.png" class="logo-micro">Los Angeles | 36 | 54 | .400 | 10 | L5 |
2026 American League Central Standings
| TEAM | W | L | PCT | GB | STRK |
|---|---|---|---|---|---|
| <img src="https://a.espncdn.com/i/teamlogos/mlb/500/chw.png" class="logo-micro">Chicago | 46 | 42 | .523 | - | W1 |
| <img src="https://a.espncdn.com/i/teamlogos/mlb/500/cle.png" class="logo-micro">Cleveland | 47 | 43 | .522 | - | L1 |
| <img src="https://a.espncdn.com/i/teamlogos/mlb/500/min.png" class="logo-micro">Minnesota | 43 | 47 | .478 | 4 | W1 |
| <img src="https://a.espncdn.com/i/teamlogos/mlb/500/det.png" class="logo-micro">Detroit | 39 | 50 | .438 | 7.5 | W1 |
| <img src="https://a.espncdn.com/i/teamlogos/mlb/500/kc.png" class="logo-micro">Kansas City | 35 | 54 | .393 | 11.5 | L4 |