
Seattle Mariners at Toronto Blue Jays
· ALCS - Game 1
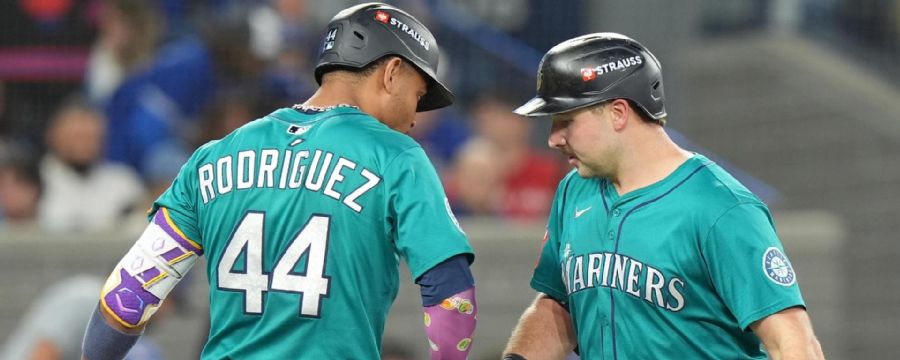
Seattle Mariners
90-72, 39-42 Away
<span class="badge bg-danger" style="font-size: 1.2em; margin: 5px 0;">Final</span>
3 - 1
3 - 1

Toronto Blue Jays
94-68, 54-27 HomeRaleigh homers, Polanco drives in 2 runs and Mariners beat Blue Jays 3-1 in ALCS opener
George Springer homered on the first pitch from Bryce Miller, who then escaped a two-on jam in a 27-pitch first inning. Anthony Santander singled in the second for Toronto's only other hit, and Seattle pitchers retired 23 of the Blue Jays' final 24 batters as Miller, Gabe Speier, Matt Brash and Andrés Muñoz combined to throw just 100 pitches.
Raleigh, who led the major leagues with 60 homers, tied the score in the sixth with his ninth homer in 14 games at Rogers Centre, Kevin Gausman had held batters to 0 for 16 on splitters in the postseason before the homer by Raleigh.
Polanco hit a go-ahead single later in the inning and added an RBI single in the eighth.
How can I watch Seattle Mariners vs. Toronto Blue Jays?
- TV Channel: Mariners at Blue Jays 2022 MLB Baseball, is broadcasted on FOX.
- Online streaming: Sign up for Fubo.
Scoring Summary
 |
9th Inning | Kirk flied out to left. |
|
9th Inning | Barger flied out to center. |
|
9th Inning | Guerrero Jr. grounded out to shortstop. |
 |
9th Inning | Muñoz relieved Brash |
|
9th Inning | Arozarena struck out looking. |
|
9th Inning | Crawford grounded out to second, Robles to second. |
Statistics
 SEA SEA |
 TOR TOR |
|
|---|---|---|
| 1 | Games Played | 1 |
| 1 | Team Games Played | 1 |
| 0 | Hit By Pitch | 0 |
| 11 | Ground Balls | 7 |
| 11 | Strikeouts | 4 |
| 3 | Runs Batted In | 1 |
| 0 | Sacrifice Hit | 0 |
| 7 | Hits | 2 |
| 2 | Stolen Bases | 0 |
| 3 | Walks | 3 |
| 0 | Catcher Interference | 0 |
| 3 | Runs | 1 |
| 0 | Ground Into Double Play | 0 |
| 0 | Sacrifice Flies | 0 |
| 34 | At Bats | 29 |
| 1 | Home Runs | 1 |
| 0 | Grand Slam Home Runs | 0 |
| 15 | Runners Left On Base | 8 |
| 0 | Triples | 0 |
| 1 | Game Winning RBIs | 0 |
| 0 | Intentional Walks | 0 |
| 1 | Doubles | 0 |
| 12 | Fly Balls | 18 |
| 0 | Caught Stealing | 0 |
| 150 | Pitches | 100 |
| 0 | Games Started | 0 |
| 0 | Pinch At Bats | 1 |
| 0 | Pinch Hits | 0 |
| 0.0 | Player Rating | 0.0 |
| 1 | Is Qualified | 1 |
| 1 | Is Qualified In Steals | 0 |
| 11 | Total Bases | 5 |
| 37 | Plate Appearances | 32 |
| 162.0 | Projected Home Runs | 162.0 |
| 2 | Extra Base Hits | 1 |
| 3.4 | Runs Created | 0.1 |
| .206 | Batting Average | .069 |
| .000 | Pinch Hit Average | .000 |
| .324 | Slugging Percentage | .172 |
| .265 | Secondary Average | .207 |
| .270 | On Base Percentage | .156 |
| .594 | OBP Pct + SLG Pct | .329 |
| 0.9 | Ground To Fly Ball Ratio | 0.4 |
| 3.4 | Runs Created Per 27 Outs | 0.1 |
| 26.0 | Batter Rating | 9.0 |
| 34.0 | At Bats Per Home Run | 29.0 |
| 1.00 | Stolen Base Percentage | 0.00 |
| 4.05 | Pitches Per Plate Appearance | 3.13 |
| .118 | Isolated Power | .103 |
| 0.27 | Walk To Strikeout Ratio | 0.75 |
| .081 | Walks Per Plate Appearance | .094 |
| .059 | Secondary Average Minus Batting Average | .138 |
| 6.0 | Runs Produced | 2.0 |
| 1.0 | Runs Ratio | 1.0 |
| 0.4 | Patience Ratio | 0.3 |
| 0.3 | Balls In Play Average | 0.0 |
| 74.8 | MLB Rating | 61.0 |
| 0.0 | Offensive Wins Above Replacement | 0.0 |
| 0.0 | Wins Above Replacement | 0.0 |
Game Information

Rogers Centre
Location: Toronto, Ontario
Attendance: 44,474 | Capacity:
2026 American League West Standings
| TEAM | W | L | PCT | GB | STRK |
|---|---|---|---|---|---|
| <img src="https://a.espncdn.com/i/teamlogos/mlb/500/sea.png" class="logo-micro">Seattle | 46 | 44 | .511 | - | W1 |
| <img src="https://a.espncdn.com/i/teamlogos/mlb/500/tex.png" class="logo-micro">Texas | 45 | 44 | .506 | 0.5 | L1 |
| <img src="https://a.espncdn.com/i/teamlogos/mlb/500/hou.png" class="logo-micro">Houston | 44 | 47 | .484 | 2.5 | W1 |
| <img src="https://a.espncdn.com/i/teamlogos/mlb/500/ath.png" class="logo-micro">Athletics | 41 | 48 | .461 | 4.5 | L2 |
| <img src="https://a.espncdn.com/i/teamlogos/mlb/500/laa.png" class="logo-micro">Los Angeles | 36 | 54 | .400 | 10 | L5 |
2026 American League East Standings
| TEAM | W | L | PCT | GB | STRK |
|---|---|---|---|---|---|
| <img src="https://a.espncdn.com/i/teamlogos/mlb/500/tb.png" class="logo-micro">Tampa Bay | 52 | 34 | .605 | - | L1 |
| <img src="https://a.espncdn.com/i/teamlogos/mlb/500/nyy.png" class="logo-micro">New York | 49 | 39 | .557 | 4 | L1 |
| <img src="https://a.espncdn.com/i/teamlogos/mlb/500/tor.png" class="logo-micro">Toronto | 42 | 47 | .472 | 11.5 | L1 |
| <img src="https://a.espncdn.com/i/teamlogos/mlb/500/bal.png" class="logo-micro">Baltimore | 42 | 48 | .467 | 12 | W3 |
| <img src="https://a.espncdn.com/i/teamlogos/mlb/500/bos.png" class="logo-micro">Boston | 39 | 48 | .448 | 13.5 | W2 |