
Toronto Blue Jays at Los Angeles Dodgers
· World Series - Game 4
6 - 2

Guerrero homers off Ohtani as Blue Jays even World Series with 6-2 win over Dodgers in Game 4
That’s when Vladimir Guerrero Jr. stepped up and told his team exactly what it needed to hear.
For all its drama, Game 3 was no more important than Game 4.
“I was the last one to go in,” Guerrero said. “I saw everybody with his head down. I said, ‘Come on, bro. Head up. It’s not over yet. It’s not over yet. They gotta win four. Four games. You have to win four games to win the World Series. It’s not over.’”
The Jays' leader then backed up his message by crushing another timely homer Tuesday night, Shohei Ohtani.
And after nine superb innings played in less than three tidy hours, these profoundly resilient Blue Jays have evened the World Series again.
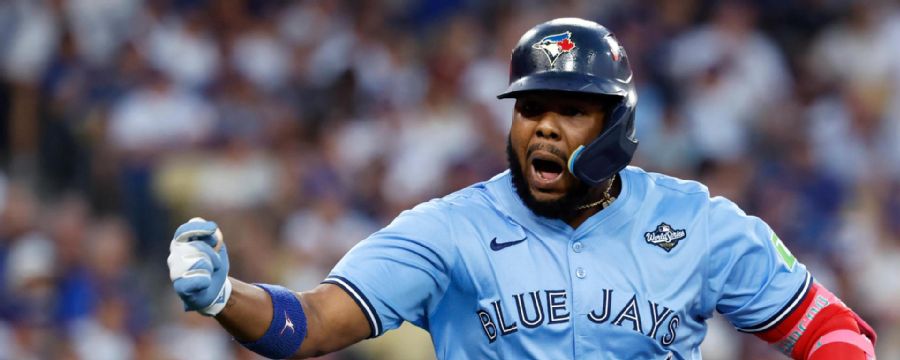
Guerrero hit a two-run homer off Ohtani in the third inning, Shane Bieber pitched four-hit ball into the sixth, and Toronto got back on track with a 6-2 victory over the Los Angeles Dodgers.
Addison Barger had two hits and an RBI for the AL champion Blue Jays, who coolly rebounded from their heartbreaking, late-night defeat with stellar work at the plate and on the mound.
“Coming off what could be a back-breaking loss last night, it was an absolute pleasure to show up today and see nobody changes,” Bieber said. “Nobody ever wavers. Nobody ever hesitates. It’s the same group of guys each and every day.”
By sending the defending champion Dodgers to just their third loss in 14 games this postseason, the Blue Jays reclaimed homefield advantage and guaranteed the World Series trophy will be won at Rogers Centre.
“I believe in this team, man,” said Guerrero, who spurred the Jays with his seventh homer of the postseason. “This team is something special.”
Game 5 is Wednesday at Dodger Stadium, with Game 6 in Toronto on Friday.
Ohtani redefined the concept of short rest by taking the World Series mound just over 17 hours after he reached base nine times and smashed four extra-base hits in the Dodgers’ stirring victory.
He yielded four runs on six hits while pitching six-plus innings with six strikeouts in Game 4. And after Guerrero hit his majestic homer, the Blue Jays tagged Ohtani for two more while chasing him during their four-run seventh.
Ohtani couldn’t make up for it at the plate, going 0 for 3 with a walk and two strikeouts. He was on deck when the game ended.
He didn't have the only poor performance at bat for the powerhouse Dodgers, who mustered just six hits — only one for extra bases.
“We're facing quality arms at this time of year against really good teams," Ohtani said through his interpreter. "We're facing the best of the best, so I think it's not that easy. At the same time, we could do at least the bare minimum and put up some runs.”
The Dodgers' two-way superstar was outpitched by Bieber, the Blue Jays newcomer who returned from Tommy John surgery in late August. The 2020 AL Cy Young Award winner gave up just one run over 5 1/3 innings in a resilient World Series debut.
An Orange County native with friends and family roaring for him from the loge level at Dodger Stadium, Bieber issued three walks, but repeatedly got out of trouble. He stranded four runners before Mason Fluharty relieved him in the sixth and stranded two more — and the Blue Jays took control moments later with their seventh-inning rally.
“I think that we knew it was going to be a great series,” Dodgers manager Dave Roberts said. “This team is talented, they’re resilient — talking about the Blue Jays — and they came back fighting. Bieber does what he does ... and we really didn’t get a whole lot of good swings. Conversely, you see those guys grinding and using the whole field and putting some hits together. We just didn’t have an answer.”
Ohtani took the mound again 11 days after he Milwaukee Brewers in arguably the greatest single-game performance in baseball playoff history to clinch the NL pennant.
Although his fastball velocity was down to 97.6 mph from his season average of 98.5, Ohtani largely stayed out of trouble with effective breaking stuff.
He also drew a six-pitch leadoff walk to reach base for the 11th straight time, extending his World Series record — but he didn't get on base again.
The Dodgers scored first for the fourth consecutive game when Kiké Hernández’s sacrifice fly brought home Max Muncy in the second. But the Blue Jays finally got to Ohtani in the third, ending their 13-inning scoring drought with a big swing from their star slugger.
Nathan Lukes hit a one-out single before Guerrero hammered a misplaced breaking ball from Ohtani over the left-center wall. Guerrero has set Toronto postseason records with seven homers and 14 RBI this month.
“A sweeper is a pitch designed to generate popups, and the swing that Vlad put on it was elite,” Toronto manager John Schneider said. “After last night and all the recognition that went into Shohei individually, and he's on the mound today, it's a huge swing from Vlad. It's a huge swing to get us going, and it gives you some momentum.”
Ohtani retired 11 of 12 after Guerrero's homer, but the Blue Jays chased him with Daulton Varsho's single and Ernie Clement's double off the wall to start the seventh. Toronto scored on Andrés Giménez's single and Ty France's groundout off Anthony Banda before Bo Bichette and Barger added RBI singles off struggling reliever Blake Treinen.
Toronto played George Springer, who left Game 3 in the seventh inning after injuring his right side on a swing.
How can I watch Toronto Blue Jays vs. Los Angeles Dodgers?
- TV Channel: Blue Jays at Dodgers 2022 MLB Baseball, is broadcasted on FOX.
- Online streaming: Sign up for Fubo.
Scoring Summary
 |
9th Inning | Call lined out to left. |
|
9th Inning | Muncy to third on a disengagement violation. |
|
9th Inning | E. Hernández struck out swinging. |
|
9th Inning | Edman grounded out to third, T. Hernández scored. |
|
9th Inning | Muncy doubled to right, T. Hernández to third. |
|
9th Inning | T. Hernández walked. |
Statistics
 TOR TOR |
 LAD LAD |
|
|---|---|---|
| 1 | Games Played | 1 |
| 1 | Team Games Played | 1 |
| 1 | Hit By Pitch | 0 |
| 12 | Ground Balls | 9 |
| 9 | Strikeouts | 7 |
| 6 | Runs Batted In | 2 |
| 0 | Sacrifice Hit | 0 |
| 11 | Hits | 6 |
| 0 | Stolen Bases | 0 |
| 3 | Walks | 4 |
| 0 | Catcher Interference | 0 |
| 6 | Runs | 2 |
| 0 | Ground Into Double Play | 1 |
| 0 | Sacrifice Flies | 1 |
| 38 | At Bats | 31 |
| 1 | Home Runs | 0 |
| 0 | Grand Slam Home Runs | 0 |
| 16 | Runners Left On Base | 16 |
| 0 | Triples | 0 |
| 1 | Game Winning RBIs | 0 |
| 2 | Intentional Walks | 0 |
| 1 | Doubles | 1 |
| 17 | Fly Balls | 16 |
| 0 | Caught Stealing | 0 |
| 145 | Pitches | 125 |
| 0 | Games Started | 0 |
| 1 | Pinch At Bats | 1 |
| 0 | Pinch Hits | 0 |
| 0.0 | Player Rating | 0.0 |
| 1 | Is Qualified | 1 |
| 0 | Is Qualified In Steals | 0 |
| 15 | Total Bases | 7 |
| 42 | Plate Appearances | 36 |
| 162.0 | Projected Home Runs | 0.0 |
| 2 | Extra Base Hits | 1 |
| 5.6 | Runs Created | 1.9 |
| .289 | Batting Average | .194 |
| .000 | Pinch Hit Average | .000 |
| .395 | Slugging Percentage | .226 |
| .184 | Secondary Average | .161 |
| .357 | On Base Percentage | .278 |
| .752 | OBP Pct + SLG Pct | .504 |
| 0.7 | Ground To Fly Ball Ratio | 0.6 |
| 5.6 | Runs Created Per 27 Outs | 1.9 |
| 40.0 | Batter Rating | 16.0 |
| 38.0 | At Bats Per Home Run | 0.0 |
| 0.00 | Stolen Base Percentage | 0.00 |
| 3.45 | Pitches Per Plate Appearance | 3.47 |
| .105 | Isolated Power | .032 |
| 0.33 | Walk To Strikeout Ratio | 0.57 |
| .071 | Walks Per Plate Appearance | .111 |
| -.105 | Secondary Average Minus Batting Average | -.032 |
| 12.0 | Runs Produced | 4.0 |
| 1.0 | Runs Ratio | 1.0 |
| 0.5 | Patience Ratio | 0.3 |
| 0.4 | Balls In Play Average | 0.3 |
| 89.0 | MLB Rating | 69.3 |
| 0.0 | Offensive Wins Above Replacement | 0.0 |
| 0.0 | Wins Above Replacement | 0.0 |
Game Information

Location: Los Angeles, California
Attendance: 52,552 | Capacity:
2026 American League East Standings
| TEAM | W | L | PCT | GB | STRK |
|---|---|---|---|---|---|
| <img src="https://a.espncdn.com/i/teamlogos/mlb/500/tb.png" class="logo-micro">Tampa Bay | 52 | 35 | .598 | - | L2 |
| <img src="https://a.espncdn.com/i/teamlogos/mlb/500/nyy.png" class="logo-micro">New York | 49 | 40 | .551 | 4 | L2 |
| <img src="https://a.espncdn.com/i/teamlogos/mlb/500/tor.png" class="logo-micro">Toronto | 42 | 48 | .467 | 11.5 | L2 |
| <img src="https://a.espncdn.com/i/teamlogos/mlb/500/bal.png" class="logo-micro">Baltimore | 42 | 49 | .462 | 12 | L1 |
| <img src="https://a.espncdn.com/i/teamlogos/mlb/500/bos.png" class="logo-micro">Boston | 40 | 48 | .455 | 12.5 | W3 |
2026 National League West Standings
| TEAM | W | L | PCT | GB | STRK |
|---|---|---|---|---|---|
| <img src="https://a.espncdn.com/i/teamlogos/mlb/500/lad.png" class="logo-micro">Los Angeles | 59 | 32 | .648 | - | L1 |
| <img src="https://a.espncdn.com/i/teamlogos/mlb/500/ari.png" class="logo-micro">Arizona | 44 | 45 | .494 | 14 | L1 |
| <img src="https://a.espncdn.com/i/teamlogos/mlb/500/sd.png" class="logo-micro">San Diego | 44 | 45 | .494 | 14 | W1 |
| <img src="https://a.espncdn.com/i/teamlogos/mlb/500/sf.png" class="logo-micro">San Francisco | 37 | 52 | .416 | 21 | L1 |
| <img src="https://a.espncdn.com/i/teamlogos/mlb/500/col.png" class="logo-micro">Colorado | 37 | 54 | .407 | 22 | W1 |