
Tampa Bay Rays at Milwaukee Brewers
· Major League Baseball
3 - 2

Fortes' tiebreaking double in 9th gives Rays 3-2 win over Brewers

Milwaukee took its first loss after opening the season with a three-game sweep of the Chicago White Sox.
Megill (0-1) retired the first two batters he faced and had a 1-2 count on Jonny DeLuca before walking him. Fortes sent a first-pitch fastball into the gap in right-center to bring home DeLuca.
Ian Seymour hit Sal Frelick with a pitch to start the bottom of the ninth before retiring the next two batters. Kevin Kelly picked up his first save by getting Blake Perkins to ground out.
All the runs before the ninth came on homers.
Yandy Díaz continued his blistering start by leading off the game by sending a 1-2 pitch from Kyle Harrison over the left-field wall. Díaz, who also singled in the second, is 11 for 20 this season.
William Contreras put Milwaukee ahead with a 415-foot drive over the center-field wall in the sixth.
The Rays tied it in the seventh when DeLuca delivered a 438-foot blast over the wall in left-center.
Milwaukee wasted a chance to break the tie in the eighth as Garrett Cleavinger (1-1) struck out Gary Sánchez to strand runners on first and second.
Both starting pitchers were making their debut with new teams.
Harrison came to Milwaukee as part of a six-player trade with Boston that sent third baseman Caleb Durbin to the Red Sox. Nick Martinez joined the Rays on a one-year, $13 million deal.
Martinez struck out three and allowed six hits, two runs and no walks in six innings. Harrison struck out eight and gave up one run, four hits and one walk in five innings.
How can I watch Tampa Bay Rays vs. Milwaukee Brewers?
- TV Channel: Rays at Brewers 2022 MLB Baseball, is broadcasted on MLB.TV.
- Online streaming: Sign up for Fubo.
Scoring Summary
 |
9th Inning | Perkins grounded into fielder's choice to shortstop, Frelick out at second. |
 |
9th Inning | Kelly relieved Seymour |
|
9th Inning | Perkins hit for Lockridge |
|
9th Inning | Hamilton flied out to left. |
|
9th Inning | Mitchell struck out swinging. |
|
9th Inning | Frelick hit by pitch. |
Statistics
 TB TB |
 MIL MIL |
|
|---|---|---|
| 1 | Games Played | 1 |
| 1 | Team Games Played | 1 |
| 0 | Hit By Pitch | 1 |
| 8 | Ground Balls | 17 |
| 14 | Strikeouts | 7 |
| 3 | Runs Batted In | 2 |
| 0 | Sacrifice Hit | 0 |
| 7 | Hits | 6 |
| 1 | Stolen Bases | 2 |
| 2 | Walks | 2 |
| 0 | Catcher Interference | 0 |
| 3 | Runs | 2 |
| 1 | Ground Into Double Play | 1 |
| 0 | Sacrifice Flies | 0 |
| 33 | At Bats | 33 |
| 2 | Home Runs | 1 |
| 0 | Grand Slam Home Runs | 0 |
| 9 | Runners Left On Base | 17 |
| 0 | Triples | 0 |
| 1 | Game Winning RBIs | 0 |
| 0 | Intentional Walks | 1 |
| 1 | Doubles | 1 |
| 11 | Fly Balls | 9 |
| 0 | Caught Stealing | 0 |
| 141 | Pitches | 132 |
| 0 | Games Started | 0 |
| 0 | Pinch At Bats | 2 |
| 0 | Pinch Hits | 0 |
| 0.0 | Player Rating | 0.0 |
| 1 | Is Qualified | 1 |
| 1 | Is Qualified In Steals | 1 |
| 14 | Total Bases | 10 |
| 35 | Plate Appearances | 36 |
| 324.0 | Projected Home Runs | 162.0 |
| 3 | Extra Base Hits | 2 |
| 3.5 | Runs Created | 2.5 |
| .212 | Batting Average | .182 |
| .000 | Pinch Hit Average | .000 |
| .424 | Slugging Percentage | .303 |
| .303 | Secondary Average | .242 |
| .257 | On Base Percentage | .250 |
| .681 | OBP Pct + SLG Pct | .553 |
| 0.7 | Ground To Fly Ball Ratio | 1.9 |
| 3.5 | Runs Created Per 27 Outs | 2.4 |
| 28.0 | Batter Rating | 21.0 |
| 16.5 | At Bats Per Home Run | 33.0 |
| 1.00 | Stolen Base Percentage | 1.00 |
| 4.03 | Pitches Per Plate Appearance | 3.67 |
| .212 | Isolated Power | .121 |
| 0.14 | Walk To Strikeout Ratio | 0.29 |
| .057 | Walks Per Plate Appearance | .056 |
| .091 | Secondary Average Minus Batting Average | .061 |
| 6.0 | Runs Produced | 4.0 |
| 1.0 | Runs Ratio | 1.0 |
| 0.5 | Patience Ratio | 0.4 |
| 0.3 | Balls In Play Average | 0.2 |
| 76.8 | MLB Rating | 71.8 |
| 0.0 | Offensive Wins Above Replacement | 0.0 |
| 0.0 | Wins Above Replacement | 0.0 |
Game Information
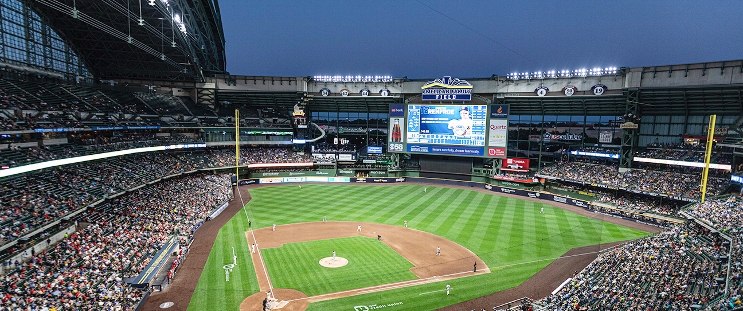
Location: Milwaukee, Wisconsin
Attendance: 20,022 | Capacity:
2026 American League East Standings
| TEAM | W | L | PCT | GB | STRK |
|---|---|---|---|---|---|
| <img src="https://a.espncdn.com/i/teamlogos/mlb/500/tb.png" class="logo-micro">Tampa Bay | 64 | 44 | .593 | - | W2 |
| <img src="https://a.espncdn.com/i/teamlogos/mlb/500/nyy.png" class="logo-micro">New York | 62 | 48 | .564 | 3 | W1 |
| <img src="https://a.espncdn.com/i/teamlogos/mlb/500/bos.png" class="logo-micro">Boston | 57 | 51 | .528 | 7 | W2 |
| <img src="https://a.espncdn.com/i/teamlogos/mlb/500/bal.png" class="logo-micro">Baltimore | 53 | 56 | .486 | 11.5 | W1 |
| <img src="https://a.espncdn.com/i/teamlogos/mlb/500/tor.png" class="logo-micro">Toronto | 50 | 59 | .459 | 14.5 | W1 |
2026 National League Central Standings
| TEAM | W | L | PCT | GB | STRK |
|---|---|---|---|---|---|
| <img src="https://a.espncdn.com/i/teamlogos/mlb/500/mil.png" class="logo-micro">Milwaukee | 67 | 41 | .620 | - | L1 |
| <img src="https://a.espncdn.com/i/teamlogos/mlb/500/chc.png" class="logo-micro">Chicago | 62 | 48 | .564 | 6 | L1 |
| <img src="https://a.espncdn.com/i/teamlogos/mlb/500/pit.png" class="logo-micro">Pittsburgh | 55 | 55 | .500 | 13 | L3 |
| <img src="https://a.espncdn.com/i/teamlogos/mlb/500/stl.png" class="logo-micro">St. Louis | 54 | 55 | .495 | 13.5 | L1 |
| <img src="https://a.espncdn.com/i/teamlogos/mlb/500/cin.png" class="logo-micro">Cincinnati | 51 | 57 | .472 | 16 | W1 |