
Tampa Bay Rays at Milwaukee Brewers
· Major League Baseball
2 - 8

Milwaukee Brewers use 6-run 8th inning to power past Tampa Bay Rays 8-2

Garrett Mitchell added a two-run double during the decisive rally, Blake Perkins drove in a run with a groundout and David Hamilton capped the inning with an RBI single as Milwaukee (5-1) broke open a 2-2 game.
Brice Turang tied it earlier with a two-run homer in the third after the Rays took the lead on Yandy Díaz’s two-run shot in the top half of the inning.
Milwaukee starter Jacob Misiorowski (1-0) struck out seven and allowed four hits and two runs in six innings. The right-hander walked two before handing the game to the bullpen. Grant Anderson, Aaron Ashby and DL Hall combined for three scoreless innings, with Hall striking out three in the ninth.
Tampa Bay (2-4) starter Drew Rasmussen allowed one run and two hits while striking out eight in five innings.
The Brewers’ eighth-inning surge opened after Joey Ortiz reached on a fielding error by shortstop Carson Williams. Turang’s sacrifice bunt was mishandled at first base, putting runners on first and second. William Contreras then singled to load the bases.
Yelich followed with a ground-ball single to right field that scored Ortiz and Turang for a 4-2 lead. Mitchell’s double to right brought home two more runs before Perkins’ RBI groundout and Hamilton’s single extended the lead to 8-2. Milwaukee went 5 for 9 with runners in scoring position.
Griffin Jax (0-2) took the loss after allowing five runs in the eighth inning.
Umpire C.B. Bucknor left the game in the second inning after being struck in the mask by a foul ball off Nick Fortes’ bat on a 100.2 mph fastball from Misiorowski.
How can I watch Tampa Bay Rays vs. Milwaukee Brewers?
- TV Channel: Rays at Brewers 2022 MLB Baseball, is broadcasted on MLB.TV.
- Online streaming: Sign up for Fubo.
Scoring Summary
 |
9th Inning | Vilade struck out swinging. |
|
9th Inning | Vilade hit for Palacios |
|
9th Inning | Williamson struck out swinging. |
|
9th Inning | Simpson singled to left, Mullins to second. |
|
9th Inning | Fortes struck out swinging. |
|
9th Inning | Mullins hit by pitch. |
Statistics
 TB TB |
 MIL MIL |
|
|---|---|---|
| 1 | Games Played | 1 |
| 1 | Team Games Played | 1 |
| 2 | Hit By Pitch | 0 |
| 9 | Ground Balls | 11 |
| 11 | Strikeouts | 10 |
| 2 | Runs Batted In | 8 |
| 0 | Sacrifice Hit | 1 |
| 5 | Hits | 9 |
| 0 | Stolen Bases | 2 |
| 3 | Walks | 2 |
| 0 | Catcher Interference | 0 |
| 2 | Runs | 8 |
| 1 | Ground Into Double Play | 1 |
| 0 | Sacrifice Flies | 0 |
| 31 | At Bats | 33 |
| 1 | Home Runs | 1 |
| 0 | Grand Slam Home Runs | 0 |
| 14 | Runners Left On Base | 11 |
| 0 | Triples | 0 |
| 0 | Game Winning RBIs | 1 |
| 0 | Intentional Walks | 0 |
| 1 | Doubles | 1 |
| 11 | Fly Balls | 13 |
| 0 | Caught Stealing | 0 |
| 137 | Pitches | 154 |
| 0 | Games Started | 0 |
| 2 | Pinch At Bats | 0 |
| 0 | Pinch Hits | 0 |
| 0.0 | Player Rating | 0.0 |
| 1 | Is Qualified | 1 |
| 0 | Is Qualified In Steals | 1 |
| 9 | Total Bases | 13 |
| 36 | Plate Appearances | 36 |
| 162.0 | Projected Home Runs | 162.0 |
| 2 | Extra Base Hits | 2 |
| 2.3 | Runs Created | 4.2 |
| .161 | Batting Average | .273 |
| .000 | Pinch Hit Average | .000 |
| .290 | Slugging Percentage | .394 |
| .226 | Secondary Average | .242 |
| .278 | On Base Percentage | .314 |
| .568 | OBP Pct + SLG Pct | .708 |
| 0.8 | Ground To Fly Ball Ratio | 0.8 |
| 2.3 | Runs Created Per 27 Outs | 4.4 |
| 18.0 | Batter Rating | 48.0 |
| 31.0 | At Bats Per Home Run | 33.0 |
| 0.00 | Stolen Base Percentage | 1.00 |
| 3.81 | Pitches Per Plate Appearance | 4.28 |
| .129 | Isolated Power | .121 |
| 0.27 | Walk To Strikeout Ratio | 0.20 |
| .083 | Walks Per Plate Appearance | .056 |
| .065 | Secondary Average Minus Batting Average | -.030 |
| 4.0 | Runs Produced | 16.0 |
| 1.0 | Runs Ratio | 1.0 |
| 0.4 | Patience Ratio | 0.4 |
| 0.2 | Balls In Play Average | 0.4 |
| 69.0 | MLB Rating | 89.8 |
| 0.0 | Offensive Wins Above Replacement | 0.0 |
| 0.0 | Wins Above Replacement | 0.0 |
Game Information
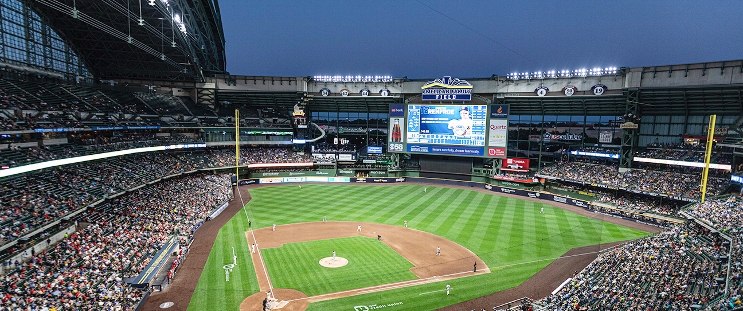
Location: Milwaukee, Wisconsin
Attendance: 21,949 | Capacity:
2026 American League East Standings
| TEAM | W | L | PCT | GB | STRK |
|---|---|---|---|---|---|
| <img src="https://a.espncdn.com/i/teamlogos/mlb/500/tb.png" class="logo-micro">Tampa Bay | 64 | 44 | .593 | - | W2 |
| <img src="https://a.espncdn.com/i/teamlogos/mlb/500/nyy.png" class="logo-micro">New York | 62 | 48 | .564 | 3 | W1 |
| <img src="https://a.espncdn.com/i/teamlogos/mlb/500/bos.png" class="logo-micro">Boston | 57 | 51 | .528 | 7 | W2 |
| <img src="https://a.espncdn.com/i/teamlogos/mlb/500/bal.png" class="logo-micro">Baltimore | 53 | 56 | .486 | 11.5 | W1 |
| <img src="https://a.espncdn.com/i/teamlogos/mlb/500/tor.png" class="logo-micro">Toronto | 50 | 59 | .459 | 14.5 | W1 |
2026 National League Central Standings
| TEAM | W | L | PCT | GB | STRK |
|---|---|---|---|---|---|
| <img src="https://a.espncdn.com/i/teamlogos/mlb/500/mil.png" class="logo-micro">Milwaukee | 67 | 41 | .620 | - | L1 |
| <img src="https://a.espncdn.com/i/teamlogos/mlb/500/chc.png" class="logo-micro">Chicago | 62 | 48 | .564 | 6 | L1 |
| <img src="https://a.espncdn.com/i/teamlogos/mlb/500/pit.png" class="logo-micro">Pittsburgh | 55 | 55 | .500 | 13 | L3 |
| <img src="https://a.espncdn.com/i/teamlogos/mlb/500/stl.png" class="logo-micro">St. Louis | 54 | 55 | .495 | 13.5 | L1 |
| <img src="https://a.espncdn.com/i/teamlogos/mlb/500/cin.png" class="logo-micro">Cincinnati | 51 | 57 | .472 | 16 | W1 |