
Philadelphia Phillies at Milwaukee Brewers
· Major League Baseball
9 - 8

J.T. Realmuto hits 3-run homer in 5-run 6th and Phillies hold off Brewers 9-8

Bryson Stott put the Phillies ahead 4-3 in the sixth with his second RBI double of the game. Realmuto followed with his fourth home run this season, and Bryce Harper added a sacrifice fly later in the inning.
Edmundo Sosa homered in the second, and Realmuto had an RBI single in a two-run fourth as the Phillies opened a 3-0 lead. Sosa, Realmuto, Kyle Schwarber and Brandon Marsh each had three of Philadelphia's 17 hits — one night after the Phillies were limited to one as Milwaukee ace Jacob Misiorowski struck out 15 batters on 95 overpowering pitches in his first career shutout.
Jackson Chourio homered twice and went 4 for 5 with four RBI for the Brewers, who have lost three of four following a four-game winning streak. Garrett Mitchell hit a two-run shot for the NL Central leaders.
Milwaukee made it 8-5 in the seventh when Chourio hit a two-run drive to center field, his second homer of the night. It was Chourio’s second multihomer game this season and the fourth of his career.
Marsh added an RBI single in the eighth before the Brewers scored three runs off Brad Keller in the bottom half. Mitchell scored on a wild pitch, Christian Yelich delivered a sacrifice fly and Chourio had an RBI single before Keller struck out Brice Turang. William Contreras, who had three hits, fouled out to end the inning.
Tim Mayza (2-1) retired Mitchell with runners at the corners to end the fifth, keeping the score tied at 3.
Jhoan Duran pitched a perfect ninth for his 18th save.
Brewers starter Shane Drohan (3-2) was lifted after allowing Marsh's leadoff single in the sixth. Drohan struck out a career-high seven and walked none but was charged with four runs and eight hits.
Chad Patrick replaced Drohan and gave up hits to the first five batters he faced. Patrick allowed four runs and five hits in one inning.
How can I watch Philadelphia Phillies vs. Milwaukee Brewers?
- TV Channel: Phillies at Brewers 2022 MLB Baseball, is broadcasted on MLB.TV.
- Online streaming: Sign up for Fubo.
Scoring Summary
 |
9th Inning | Frelick flied out to left. |
|
9th Inning | Mitchell struck out swinging. |
|
9th Inning | Bauers grounded out to second. |
 |
9th Inning | Duran relieved Keller |
|
9th Inning | Turner struck out looking. |
|
9th Inning | Schwarber intentionally walked. |
Statistics
 PHI PHI |
 MIL MIL |
|
|---|---|---|
| 1 | Games Played | 1 |
| 1 | Team Games Played | 1 |
| 0 | Hit By Pitch | 0 |
| 9 | Ground Balls | 15 |
| 15 | Strikeouts | 6 |
| 9 | Runs Batted In | 7 |
| 0 | Sacrifice Hit | 0 |
| 17 | Hits | 12 |
| 2 | Stolen Bases | 0 |
| 3 | Walks | 4 |
| 0 | Catcher Interference | 0 |
| 9 | Runs | 8 |
| 0 | Ground Into Double Play | 0 |
| 1 | Sacrifice Flies | 1 |
| 43 | At Bats | 38 |
| 2 | Home Runs | 3 |
| 0 | Grand Slam Home Runs | 0 |
| 18 | Runners Left On Base | 14 |
| 0 | Triples | 0 |
| 1 | Game Winning RBIs | 0 |
| 1 | Intentional Walks | 0 |
| 2 | Doubles | 0 |
| 20 | Fly Balls | 18 |
| 0 | Caught Stealing | 0 |
| 177 | Pitches | 165 |
| 0 | Games Started | 0 |
| 0 | Pinch At Bats | 1 |
| 0 | Pinch Hits | 1 |
| 0.0 | Player Rating | 0.0 |
| 1 | Is Qualified | 1 |
| 1 | Is Qualified In Steals | 0 |
| 25 | Total Bases | 21 |
| 47 | Plate Appearances | 43 |
| 324.0 | Projected Home Runs | 486.0 |
| 4 | Extra Base Hits | 3 |
| 10.5 | Runs Created | 7.9 |
| .395 | Batting Average | .316 |
| .000 | Pinch Hit Average | 1.000 |
| .581 | Slugging Percentage | .553 |
| .302 | Secondary Average | .342 |
| .426 | On Base Percentage | .372 |
| 1.007 | OBP Pct + SLG Pct | .925 |
| 0.5 | Ground To Fly Ball Ratio | 0.8 |
| 10.5 | Runs Created Per 27 Outs | 7.9 |
| 65.0 | Batter Rating | 51.0 |
| 21.5 | At Bats Per Home Run | 12.7 |
| 1.00 | Stolen Base Percentage | 0.00 |
| 3.77 | Pitches Per Plate Appearance | 3.84 |
| .186 | Isolated Power | .237 |
| 0.20 | Walk To Strikeout Ratio | 0.67 |
| .064 | Walks Per Plate Appearance | .093 |
| -.093 | Secondary Average Minus Batting Average | .026 |
| 18.0 | Runs Produced | 15.0 |
| 1.0 | Runs Ratio | 0.9 |
| 0.6 | Patience Ratio | 0.6 |
| 0.6 | Balls In Play Average | 0.3 |
| 110.3 | MLB Rating | 100.3 |
| 0.0 | Offensive Wins Above Replacement | 0.0 |
| 0.0 | Wins Above Replacement | 0.0 |
Game Information
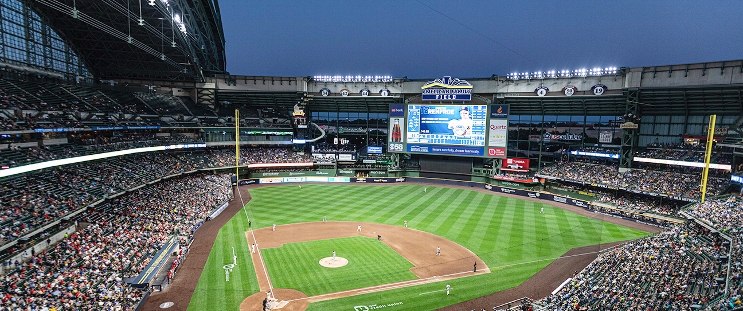
Location: Milwaukee, Wisconsin
Attendance: 40,157 | Capacity:
2026 National League East Standings
| TEAM | W | L | PCT | GB | STRK |
|---|---|---|---|---|---|
| <img src="https://a.espncdn.com/i/teamlogos/mlb/500/atl.png" class="logo-micro">Atlanta | 62 | 43 | .590 | - | W1 |
| <img src="https://a.espncdn.com/i/teamlogos/mlb/500/phi.png" class="logo-micro">Philadelphia | 57 | 49 | .538 | 5.5 | W1 |
| <img src="https://a.espncdn.com/i/teamlogos/mlb/500/wsh.png" class="logo-micro">Washington | 54 | 52 | .509 | 8.5 | W2 |
| <img src="https://a.espncdn.com/i/teamlogos/mlb/500/mia.png" class="logo-micro">Miami | 52 | 54 | .491 | 10.5 | L12 |
| <img src="https://a.espncdn.com/i/teamlogos/mlb/500/nym.png" class="logo-micro">New York | 44 | 62 | .415 | 18.5 | W1 |
2026 National League Central Standings
| TEAM | W | L | PCT | GB | STRK |
|---|---|---|---|---|---|
| <img src="https://a.espncdn.com/i/teamlogos/mlb/500/mil.png" class="logo-micro">Milwaukee | 66 | 39 | .629 | - | W2 |
| <img src="https://a.espncdn.com/i/teamlogos/mlb/500/chc.png" class="logo-micro">Chicago | 59 | 46 | .562 | 7 | L1 |
| <img src="https://a.espncdn.com/i/teamlogos/mlb/500/pit.png" class="logo-micro">Pittsburgh | 54 | 52 | .509 | 12.5 | W1 |
| <img src="https://a.espncdn.com/i/teamlogos/mlb/500/stl.png" class="logo-micro">St. Louis | 53 | 52 | .505 | 13 | L1 |
| <img src="https://a.espncdn.com/i/teamlogos/mlb/500/cin.png" class="logo-micro">Cincinnati | 49 | 55 | .471 | 16.5 | W1 |