
New York Mets at Milwaukee Brewers
· Major League Baseball
New York Mets
40-55, 19-29 Awayvs

Milwaukee Brewers
59-36, 29-18 HomeHow To Watch
How can I watch New York Mets vs. Milwaukee Brewers?
- TV Channel: Mets at Brewers 2022 MLB Baseball, is broadcasted on MLB.TV.
- Online streaming: Sign up for Fubo.
Matchup Prediction
Brewers: 71.1%
Mets: 28.9%
*According to ESPN's Basketball Power Index
Statistics
 NYM NYM |
 MIL MIL |
|
|---|---|---|
| 95 | Games Played | 93 |
| 95 | Team Games Played | 93 |
| 34 | Hit By Pitch | 21 |
| 1064 | Ground Balls | 1202 |
| 775 | Strikeouts | 759 |
| 377 | Runs Batted In | 450 |
| 14 | Sacrifice Hit | 25 |
| 752 | Hits | 808 |
| 46 | Stolen Bases | 86 |
| 291 | Walks | 382 |
| 4 | Catcher Interference | 7 |
| 396 | Runs | 476 |
| 67 | Ground Into Double Play | 52 |
| 23 | Sacrifice Flies | 23 |
| 3195 | At Bats | 3168 |
| 111 | Home Runs | 86 |
| 2 | Grand Slam Home Runs | 0 |
| 0 | Runners Left On Base | 0 |
| 12 | Triples | 14 |
| 39 | Game Winning RBIs | 55 |
| 8 | Intentional Walks | 18 |
| 117 | Doubles | 166 |
| 1393 | Fly Balls | 1255 |
| 21 | Caught Stealing | 28 |
| 13890 | Pitches | 14246 |
| 95 | Games Started | 93 |
| 79 | Pinch At Bats | 84 |
| 16 | Pinch Hits | 13 |
| 0.0 | Player Rating | 0.0 |
| 1 | Is Qualified | 1 |
| 1 | Is Qualified In Steals | 1 |
| 1226 | Total Bases | 1260 |
| 3561 | Plate Appearances | 3626 |
| 189.0 | Projected Home Runs | 150.0 |
| 240 | Extra Base Hits | 266 |
| 371.6 | Runs Created | 443.8 |
| .235 | Batting Average | .255 |
| .203 | Pinch Hit Average | .155 |
| .384 | Slugging Percentage | .398 |
| .247 | Secondary Average | .282 |
| .304 | On Base Percentage | .337 |
| .688 | OBP Pct + SLG Pct | .735 |
| 0.8 | Ground To Fly Ball Ratio | 1.0 |
| 3.9 | Runs Created Per 27 Outs | 4.8 |
| 2941.0 | Batter Rating | 3371.0 |
| 28.8 | At Bats Per Home Run | 36.8 |
| 0.69 | Stolen Base Percentage | 0.75 |
| 3.90 | Pitches Per Plate Appearance | 3.93 |
| .148 | Isolated Power | .143 |
| 0.38 | Walk To Strikeout Ratio | 0.50 |
| .082 | Walks Per Plate Appearance | .105 |
| .012 | Secondary Average Minus Batting Average | .027 |
| 773.0 | Runs Produced | 926.0 |
| 1.0 | Runs Ratio | 0.9 |
| 0.5 | Patience Ratio | 0.5 |
| 0.3 | Balls In Play Average | 0.3 |
| 2102.3 | MLB Rating | 2400.5 |
| 0.0 | Offensive Wins Above Replacement | 0.0 |
| 0.0 | Wins Above Replacement | 0.0 |
Game Information
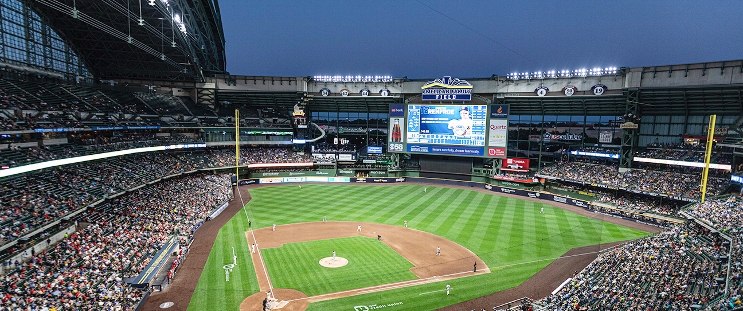
American Family Field
Location: Milwaukee, Wisconsin
Capacity:
2026 National League East Standings
| TEAM | W | L | PCT | GB | STRK |
|---|---|---|---|---|---|
| <img src="https://a.espncdn.com/i/teamlogos/mlb/500/atl.png" class="logo-micro">Atlanta | 54 | 39 | .581 | - | L1 |
| <img src="https://a.espncdn.com/i/teamlogos/mlb/500/phi.png" class="logo-micro">Philadelphia | 52 | 43 | .547 | 3 | L1 |
| <img src="https://a.espncdn.com/i/teamlogos/mlb/500/mia.png" class="logo-micro">Miami | 52 | 44 | .542 | 3.5 | L2 |
| <img src="https://a.espncdn.com/i/teamlogos/mlb/500/wsh.png" class="logo-micro">Washington | 48 | 48 | .500 | 7.5 | L2 |
| <img src="https://a.espncdn.com/i/teamlogos/mlb/500/nym.png" class="logo-micro">New York | 40 | 55 | .421 | 15 | L1 |
2026 National League Central Standings
| TEAM | W | L | PCT | GB | STRK |
|---|---|---|---|---|---|
| <img src="https://a.espncdn.com/i/teamlogos/mlb/500/mil.png" class="logo-micro">Milwaukee | 59 | 36 | .621 | - | L2 |
| <img src="https://a.espncdn.com/i/teamlogos/mlb/500/chc.png" class="logo-micro">Chicago | 52 | 42 | .553 | 6.5 | L2 |
| <img src="https://a.espncdn.com/i/teamlogos/mlb/500/stl.png" class="logo-micro">St. Louis | 49 | 44 | .527 | 9 | W1 |
| <img src="https://a.espncdn.com/i/teamlogos/mlb/500/pit.png" class="logo-micro">Pittsburgh | 49 | 47 | .510 | 10.5 | W2 |
| <img src="https://a.espncdn.com/i/teamlogos/mlb/500/cin.png" class="logo-micro">Cincinnati | 43 | 50 | .462 | 15 | W1 |
Mets Last 5
| Date | OPP | Result |
|---|---|---|
| @ <img src="https://a.espncdn.com/i/teamlogos/mlb/500/atl.png" style="padding-left: 4px; width: 20px; vertical-align: inherit;"> ATL | W 7-6 F/10 | |
| vs <img src="https://a.espncdn.com/i/teamlogos/mlb/500/kc.png" style="padding-left: 4px; width: 20px; vertical-align: inherit;"> KC | L 16-12 | |
| vs <img src="https://a.espncdn.com/i/teamlogos/mlb/500/kc.png" style="padding-left: 4px; width: 20px; vertical-align: inherit;"> KC | W 6-2 | |
| vs <img src="https://a.espncdn.com/i/teamlogos/mlb/500/kc.png" style="padding-left: 4px; width: 20px; vertical-align: inherit;"> KC | W 7-3 | |
| vs <img src="https://a.espncdn.com/i/teamlogos/mlb/500/bos.png" style="padding-left: 4px; width: 20px; vertical-align: inherit;"> BOS | L 6-2 |
Brewers Last 5
| Date | OPP | Result |
|---|---|---|
| @ <img src="https://a.espncdn.com/i/teamlogos/mlb/500/stl.png" style="padding-left: 4px; width: 20px;"> STL | W 4-3 | |
| @ <img src="https://a.espncdn.com/i/teamlogos/mlb/500/stl.png" style="padding-left: 4px; width: 20px;"> STL | W 10-2 | |
| @ <img src="https://a.espncdn.com/i/teamlogos/mlb/500/stl.png" style="padding-left: 4px; width: 20px;"> STL | L 5-1 | |
| @ <img src="https://a.espncdn.com/i/teamlogos/mlb/500/stl.png" style="padding-left: 4px; width: 20px;"> STL | W 8-4 | |
| @ <img src="https://a.espncdn.com/i/teamlogos/mlb/500/pit.png" style="padding-left: 4px; width: 20px;"> PIT | L 7-6 |